
.jpg)
 - Copy copy.png)

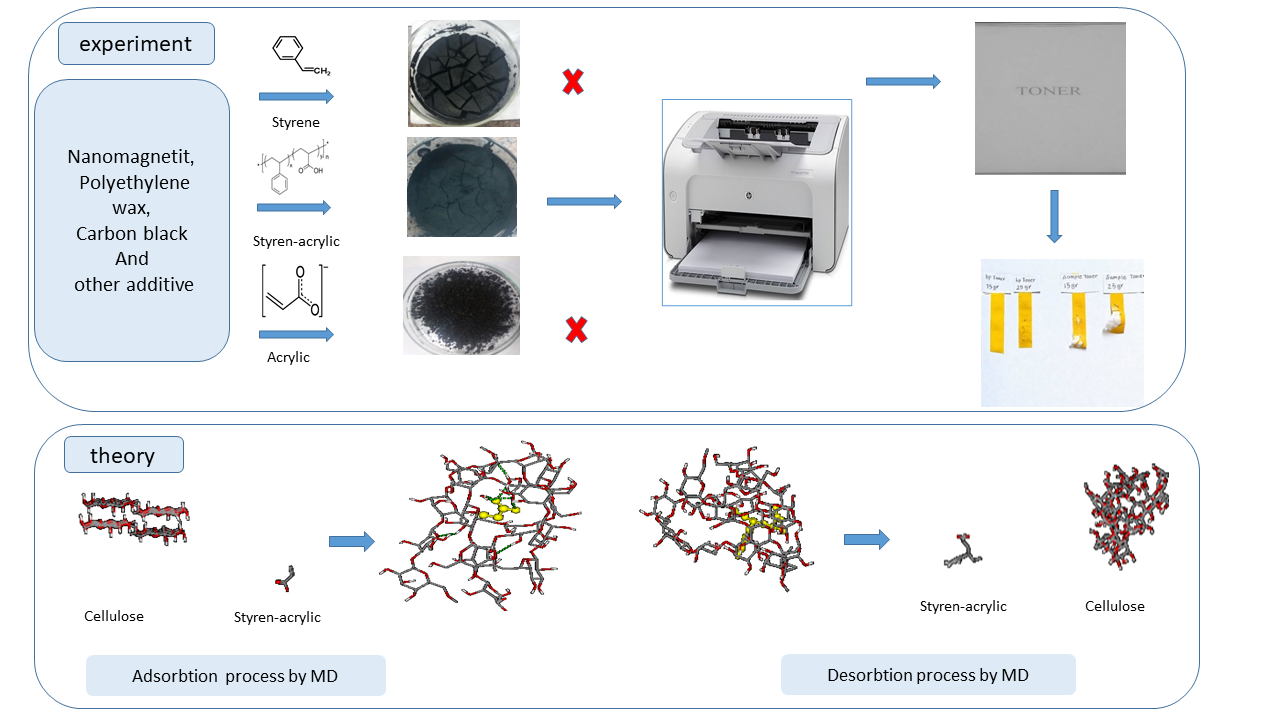
Visual Abstract
Abstract
Toner, a crucial component in photocopiers and laser printers, primarily consists of polymer resins, dyes, charge control agents, and additives, with polymers constituting approximately 80% of their weight. This research investigates the synthesis of toners using three distinct types of polymers: styrene, styrene-acrylic, and acrylic. Experimental results indicated that among the three polymers, the styrene-acrylic polymer produced the smallest average particle size (12.21 µm), which enhanced toner adhesion to paper compared to the other two polymers. Also using Molecular dynamics (MD) simulation using GROMACS (Groningen Machine for Chemical Simulations) software, the adsorption and desorption behaviors of these polymers on cellulose surfaces were analyzed, revealing significant correlations between polymer characteristics and toner particle size. This study provided valuable insights into optimizing toner formulations for improved print quality by selecting appropriate polymer properties, thereby advancing the field of printing technology.
Introduction
Laser printers are a type of computer printer that uses laser beams to apply toner onto paper. In recent years, laser printers have captured the attention of users due to their advanced features. Manufacturers of these printers have marketed various models based on new demands and advancements in technology [1,2]. Laser printers work based on an electrography system in which polymer toner powder is fixed on the substrate or bed by electrostatic force. In this case, the toner melts on the bed in layer form due to contact with hot rollers or through infrared waves [1–4].
Toner is a dry powder with an average particle size of 2–8 μm. Two main methods are used to produce toners: pulverization and chemical methods. Chemical methods allow for greater control over particle size and shape, thereby enhancing toner quality, which depends on these factors. Emulsion aggregation (EA) and in-situ suspension are considered two primary chemical methods for toner production [5,6]. Toner consists of dye agents, such as carbon black used in black toners, along with charge control agents (CCA) that regulate the electrostatic charge on toner particles, essential for transferring toner to the drum surface. External additives like silica foam optimize this transfer process and prevent toner particles from clumping together [7–9].
The bulk of the toner consists of a resin, which comprises approximately 70% to 90% of its composition. This resin is typically made from polyester, styrene-acrylic, or styrene-butadiene-based polymers [10]. The role of resin in toner is to bind the dye to paper or transparent materials to create a visual image. Toner polymers can be optimized by combining different monomers or polymer chains to achieve specific properties. However, the primary function of the resin is to immobilize the dye on the paper. Designing a polymer with optimal melting properties is considered the main factor in polymer modification [11]. Polypropylene, polyethylene, or ethylene vinyl acetate copolymers, or a mixture of these materials with low molecular weight, have previously been used as resins in toners that are immobilized on a substrate by applying pressure [12]. In another method, polyester and epoxy resins are utilized. In this approach, the molecular weight of the polymer resin ranges from 5,000 to 50,000 g/mol, and the glass transition temperature is between 50 and 60 °C. Continuous radiation sources, such as quartz lights or heated coils, are employed to melt the toner into the paper fibers [13]. Epoxy and polycarbonate copolymers are utilized in instantaneous melters, where the toner is melted in less than 500 milliseconds through a rapid pass of high-energy light from the paper. Styrene copolymers, including styrene acrylate, styrene methacrylate, and styrene butadiene, are commonly employed in various photocopiers with heat rollers to immobilize the toner on the paper surface. In this process, the paper passes through two hot rollers with non-melted toner, allowing the toner to melt and stabilize on the paper’s surface. The molecular weight of these resins ranges from 30,000 to 100,000 g/mol, and their glass transition temperature is typically between 50°C and 65°C. When a lower melting temperature is necessary to stabilize the toner, polyester is used as the resin. This is particularly important in color copies where multiple layers of toner need to be melted. Almost all photocopiers and color printers utilize toners made from polyester family polymer resins [16]. The resin used in toner synthesis, such as styrene-acrylic, must have a low glass transition temperature, typically between 60 and 70°C while exhibiting a high viscosity. Styrene acrylic resins, such as n-butyl methacrylate, are of particular importance. Differences in the properties of the copolymers, unlike the properties of the other components, significantly affect the particle size [17,18].
This study investigates the effects of glass transition temperature and viscosity on the production and final quality of toner. The research was conducted using three different types of polymers: styrene, styrene-acrylic, and acrylic polymers. A key innovation of this paper is the application of molecular dynamics simulation to analyze the adsorption and desorption behavior of these polymers on cellulose surfaces. The results indicate that the styrene-acrylic polymer, with an average particle size of 12.21 microns, exhibits the best performance regarding adhesion to paper. The careful selection of polymer type and its properties can significantly influence print quality and printer performance. The findings of this study could lead to the production of higher-quality and more efficient toners.
Experimental section
Materials
Used polymers in toner synthesis of this study: Styrene with commercial name of Polyfam 708 produced by Resin Fam Company, Styrene-Acrylic with commercial name of 350s produced by Abnil Chemistry Company, and Acrylic Resin with the name of Polytex–217 prepared by Iran polymer company. The specifications of these polymers are according to Table 1. In addition, the used carbon black powder in this study was printed and, produced by Degussa-Evonik Company. Polyethylene wax was made by Giti Pasand Company. Magnetic iron nanoparticles were synthesized at Damghan University [19–21]. Poly-aluminum chloride was also used as a coagulation agent.
Polymer | pH | Viscosity (cp) | Glass transition temperature |
Styrene-acrylic | 7–8 | 150 | 50 |
Styrene | 6–7 | 4000 | 40 |
Acrylic | 6 | 5000 | 15 |
Toner synthesis
78 g resin, 13 g carbon black, 8 g magnetic iron nanoparticles, and 120 g deionized water were stirred by a mechanical mixer in a one-liter beaker for one hour. Then 0.5 g of poly-aluminum chloride mixture with 2 ml nitric acid was added to it and the temperature was slowly increased to 50 oC, and after one hour, the temperature slowly increased to 90 oC. Then the mixture was neutralized with sodium hydroxide. After one hour, the product was rinsed with distilled water to remove excess ions [22–25].
Theoretical section
Initial simulation structures
To study the adsorption of three different polymers (styrene-acrylic, styrene, and acrylic) on the cellulose surface, the structure of polymers was first drawn using Hyperchem 7 software, and their final geometric structures were optimized by the semi-empirical AM1 method. The PRODRG server was used to generate force field parameters.
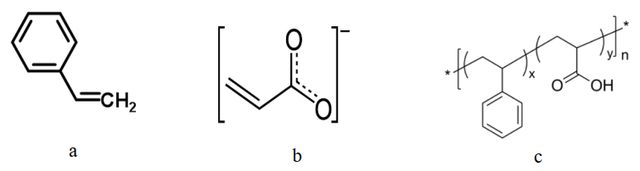
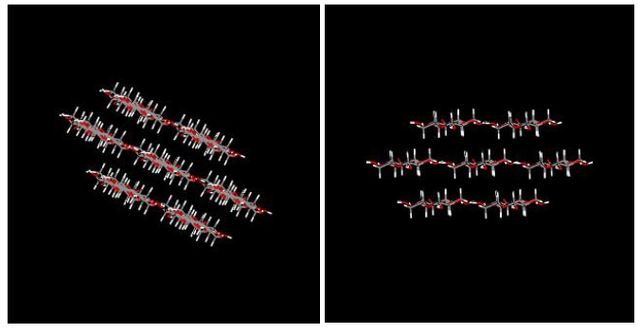
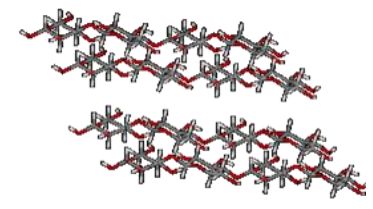
Figure 2 shows the crystal structure of cellulose taken from [26]. To create the initial configuration, the polymer was placed outside the cellulose surface and far enough away to minimize the effect of initial orientations. Then, several SPC / E waters models were added to the simulation box. The molecular dynamics simulation was performed using the Gromacs software version 5.1.2. to model atomic interactions, the GROMOSE96 force field was applied. Temperatures were adjusted close to the desired values using the Nose-Hoover algorithm. The pressure was also set to a constant value of 1 bar using the Parrilla-Rahman algorithm. The Leap-Frog integration algorithm was used to solve the equation of motion with a 2 femto second-time step. The LINCS algorithm was used to constrain all bonds, including hydrogen bonds. The Particle Mesh Ewald (PME) method was used to calculate electrostatic long-range interactions, while electrostatic interactions between charged groups were implicitly calculated in the range of 1.5 nm. The Lenard Jones (L-J) and Van der Waals interactions were calculated in the cut-off range of 1.5 nm. The Grid algorithm was used to search for neighbors.
Simulation details
To study the polymer type and the adsorption rate of three polymers (styrene-acrylic, acrylic, and styrene), the structure of three polymers was plotted with one monomer unit, and its topological and structural files were entered into a \(5.9\times 5.7\times 5.7nm^{3}\) box. Then cellulose and its structural and topological parameters were introduced into the system. The waterless system was optimized in the gas environment. Optimization was performed for 20 nanoseconds and the results were analyzed. Also, to study the effect of temperature, the above systems were simulated at three temperatures of 468, 478, and 488 K, which is in the melting point temperature of the toner polymer on the cellulose surface of the paper, and results were analyzed and compared. Due to the high temperatures and the inappropriate application of these temperatures on cellulose, a temperature of 300 K was applied to the cellulose. In this way, the temperature effect of the experimental melting range of the polymer on the cellulose is just studied. The environment of the system was gaseous and the calculations were performed in the absence of solvent and the size of the box was adjusted as before.
For the desorption study, the absorbed system, No. 2 of Table 2, which showed the best absorption state and had the best compatibility with the experimental results, was selected. This system was selected as the primary state in the desorbed state (the final system obtained from the simulation of the previous section) and its desorption force was measured by Steered Molecular Dynamics. To this end, the cellulose structure was kept fixed using freeze groups. Its fixing dimensions were selected in three x, y, and z directions. The polymer molecule was pulled from the absorbed state by the pull code command and became desorbed. The polymer desorption rate was selected as 0.0002. The polymer was pulled only in the x direction. Desorption force is obtained from the slope of the potential curve vs. distance based on the following equation (1).
\(F=-\frac{\partial U}{\partial x}\)
No | Polymer | Temperature, K |
1 | Styrene-acrylic | 468 |
2 | Styrene-acrylic | 478 |
3 | Styrene-acrylic | 488 |
4 | Styrene | 468 |
5 | Styrene | 478 |
6 | Styrene | 488 |
7 | Acrylic | 468 |
8 | Acrylic | 478 |
9 | Acrylic | 488 |
10 | Styrene-acrylic | Based on the above table |
11 | Acrylic | Based on the above table |
12 | Styrene | Based on the above table |

Result and Discussion
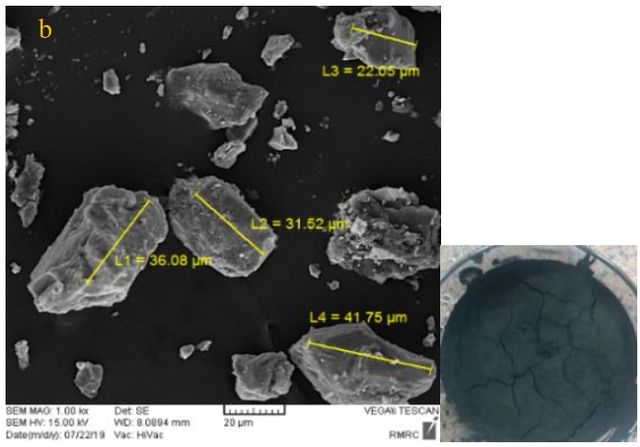
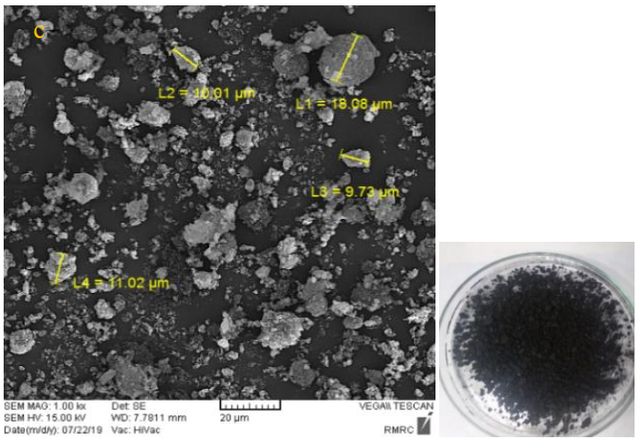
Figure 3 shows SEM pictures of three synthesized toners with three different: styrene, styrene-acrylic, and acrylic polymers. The average particle size in the synthesized toner with styrene-acrylic polymer is lower than two other synthesized toners with styrene and acrylic. The average particle size in synthesized toner with styrene-acrylic polymer is 12.21 \(\mu m\), for the acrylic polymer is 32.85 \(\mu m\), and for styrene is 21.61 \(\mu m\).
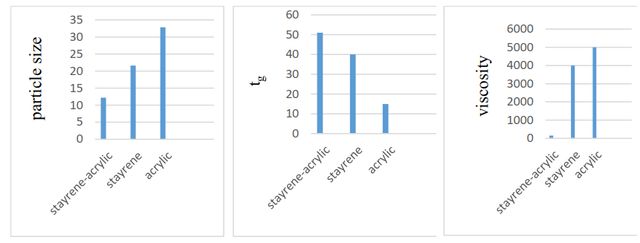
According to Figure 4, by comparing the particle size, glass transition temperatures (Tg) as well as viscosity between the three synthesized toners, it can be concluded that viscosity and glass transition temperature in the selected polymers affects the particle size. A comparison of two glass transition temperatures and the average particle size shows the correlation between them. According to the diagram and comparison of the three toner samples, the higher the glass transition temperature, the smaller the particle size. In general, a moderate Tg level is required to stabilize the toner on paper. If the Tg is too high, it will cause energy consumption, and the lower the Tg, the more the toner will bind to the printer cartridge. By comparison of particle size and viscosity diagrams, it can be concluded that the viscosity value for the proper toner synthesis is within a certain range. This range can be between (400–700 cp) [3].
Investigating the effect of particle size on toner adsorption onto paper by glue test
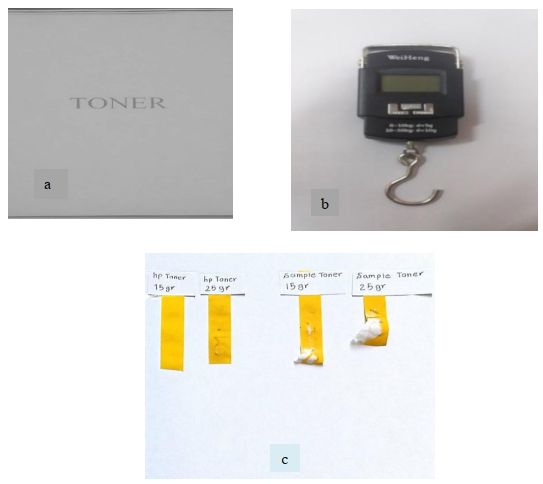
A scale and glue were used to check the adhesion of the toner to the paper (Figure 5). In this section, the synthesized toner with styrene and acrylic polymer was removed from this test due to non-adhesion on paper. To check the adhesion of styrene-acrylic toner on paper, HP toner was selected as the reference and was compared with synthesized toner with styrene-acrylic polymer.
The scale was calibrated with a 100 g weight. In this method, a piece of glue was placed on the scale hook and a part of it was placed on the printed text, and it was pulled with the same angle and speed and the force of 1.5 and 2.5 N. The standard toner did not separate from the paper with a force of 1.5 N. In the synthesized toner with styrene-acrylic polymer, a thin layer was separated from the printed text with glue. Due to the non-uniformity of the particles compared to the HP toner, larger particles remained on the surface layers, which were separated with glue. This test was performed under a force of 2.5 N. In this part, the HP toner was separated from the paper by glue with a thin layer of paper, and the styrene-acrylic toner caused a complete rupture of the paper due to the penetration of fine particles into the cellulose.
The constituent components play an important role in the size of the toner particles. In this way, it is possible to have a more appropriate and controllable production process with the right choice of these components. Three different polymers of styrene-acrylic, styrene, and acrylic were studied in toner synthesis. The results showed that styrene-acrylic with a Tg value of 50 and a cp viscosity of 80–150 could be more suitable than other selected polymers in toner synthesis under the same reaction conditions and the same material. The synthesized toner with this polymer claims the production of a toner with properties close to the standard toner. Therefore, it is very important to choose a polymer with suitable components that reduce particle size and improve print quality [27].
System equilibrium
Equilibration of the system is checked through quantities such as total energy, Lenard Jones. energy, temperature, and pressure.
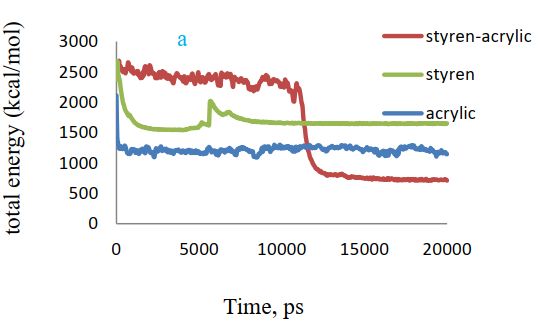
According to Figure 6 (a), a comparison of total energy in the presence of three different polymers shows that there is less total energy or more system stability in the presence of styrene-acrylic polymer. The reason is due to the absorption of polymer on cellulose and the formation of a more stable system.
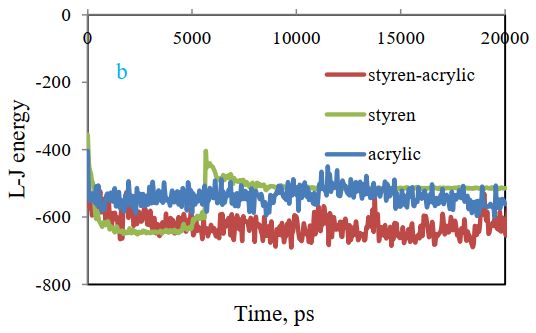
Lenard-Jones energy changes between cellulose and polymer are depicted in Figure 6(b). The results show that energy for the styrene-acrylic system is reduced. This shows that the most stable state is related to styrene-acrylic and the most unstable state is observed for the acrylic system.
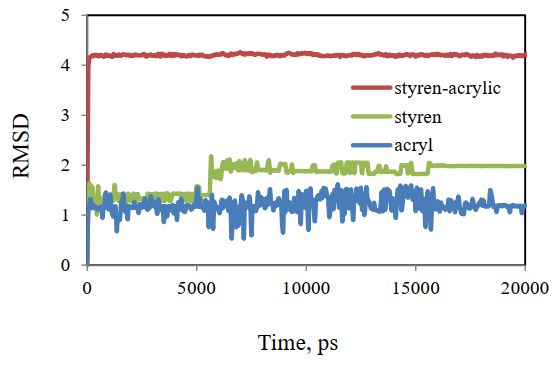
The initial and final structure obtained in the simulation can be compared by fitting the root mean squares deviation (RMSD). Figure 7 shows the RMSD curve of cellulose and polymer structures after fitting the mean squares. The low least square for these structures shows how little these structures have changed. Most of the change is related to acrylic styrene, and the flattening of the diagram in Figure 7 indicates that the system has reached equilibrium.
The results show that the total energy of the studied systems gradually reaches a constant value, and the equilibrium of the systems indicates that they can be used for further analysis.
Comparing adsorption of three styrene-acrylic, styrene, and acrylic polymers
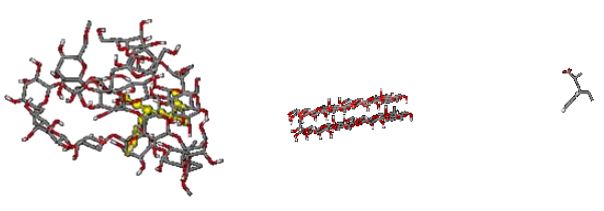
Three different systems, including cellulose and polymer (styrene acrylic, styrene, and acrylic), were selected at 478 K to compare the absorption of styrene acrylic, styrene, and acrylic since the best empirical adsorption of styrene-acrylic on cellulose occurs at 478 K. The initial structure of cellulose used in all systems before optimization is shown in Figure 8. Figures 9 and 10 show the initial and final simulation systems for these three polymers, respectively, after 20 nanoseconds.
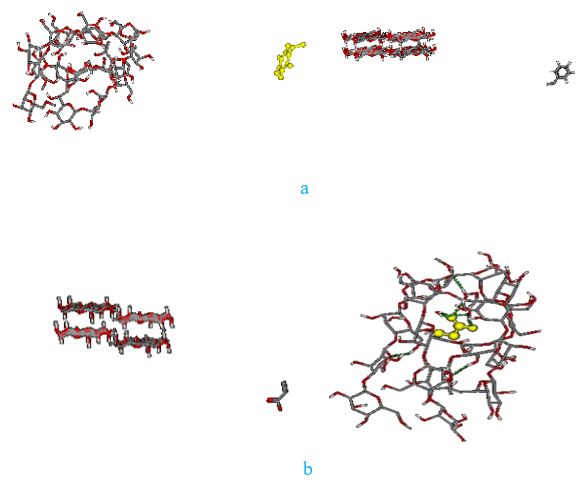
The results indicate that among three polymers, acrylic and styrene-acrylic can be adsorbed on cellulose. But the best and the fastest absorption has been seen for styrene -acrylic. This absorption can be attributed to the formation of hydrogen bonds between the polymer and cellulose. The hydrogen atom of cellulose establishes a hydrogen bond with the oxygen atom of styrene- acrylic or acrylic and affects the polymer adsorption, and the reason for the non-adsorption of the styrene can be attributed to the lack of such a hydrogen bond. Figure 11 shows the established hydrogen bond between cellulose and styrene-acrylic after the adsorption process within 20 ns. It has been observed that the formation of hydrogen bonds between cellulose molecules has also changed the shape of cellulose.
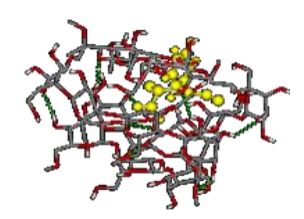
After 20 nanoseconds, the styrene-acrylic polymer was able to approach cellulose and penetrate into the layer, forming a hydrogen bond with it, which could be the reason for the toner adsorption on cellulose.
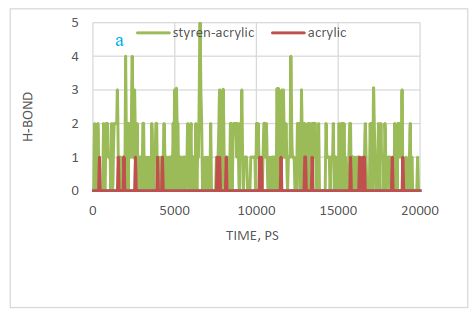
Hydrogen bond changes were also investigated at a distance of 0.35 nm and confirmed the results of the above figure. Figure 12 (a) shows these changes and confirms that there is no hydrogen bond between styrene and cellulose after 20 ns optimization. That is why styrene is not absorbed by cellulose. According to this diagram, the most hydrogen bonding or adsorption can be seen for styrene-acrylic with cellulose.
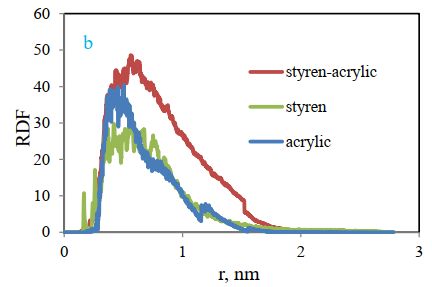
The radial distribution (RDF) function of cellulose-polymer is also compared in Figure 12 (b). The radial distribution function indicates the possibility of the presence of two molecules beside each other, and this figure shows the highest intensity for the styrene-acrylic polymer and the lowest for the styrene. This means that the highest adsorption and interaction have been observed for styrene-acrylic.
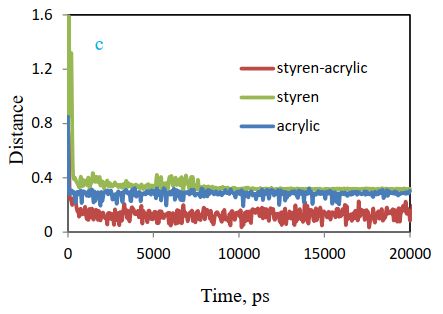
Figure 12 (c) compares the distance between polymer and cellulose. According to the chart, the gap between them has reduced over time, and a higher decline has been observed for styrene-acrylic, which confirms the above results.
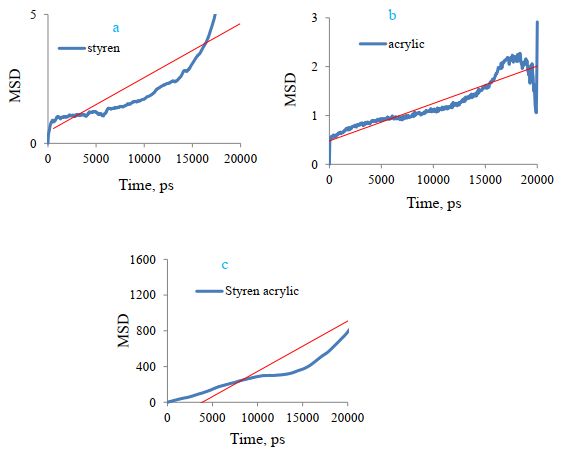
Figures 13 show the minimum square displacement curve (MSD) of the polymer, and the results confirm more square displacement or more styrene-acrylic transfer to cellulose. The slope of this curve can be used to calculate the diffusion coefficient (DA). Table 3 shows the constant values of DA diffusion. The slope of the MSD curve is greater for styrene-acrylic, which has shown the greatest adsorption or diffusion.
Sample No. based on Table 2 | DA(nm2)ps–1 | Polymer |
2 | 0.01 | Styrene-acrylic |
5 | 0.0001 | Styrene |
8 | 0.00000013 | acrylic |
Temperature effect on adsorption of three polymers
9 calculations were performed for this section. The adsorption of three polymers on cellulose was investigated and compared at three different temperatures. Due to the large number of calculations, only the results of the temperature effect for absorption of styrene-acrylic polymer on cellulose at three temperatures of 468, 478, and 488 K have been compared as a sample model.
Styrene-acrylic can be melted and adsorbed on cellulose at a temperature of 359/159 oC in reality. To test the equilibrium of the system as before, Lenard Jones’s energy, total energy, and RMSD were obtained and compared. Figure 14 shows these results. The analyses show that the total energy of the studied systems reaches a constant value and the equilibrium of the systems indicates that they can be used for further analysis and more structural changes can be observed in the RMSD diagram at 478 K.
Hydrogen bonding changes were also investigated at a distance of 0.35 nm. Figure 14(d) shows these changes. According to this diagram, the highest hydrogen bonding or adsorption is observed for styrene-acrylic with cellulose at 478 K.
The radial distribution function (RDF) of cellulose-styrene-acrylic at three different temperatures is also compared in Figure 15 (a). The radial distribution function shows the highest probability of the presence of two molecules beside each other for styrene-acrylic polymer at 478 K.
Figure 15 (b) compares the distance between polymer and cellulose at three temperatures. Based on the chart, the distance between the two compounds has decreased over time and the highest decrease is observed for styrene-acrylic at 478, after adsorption, the molecule has not changed much due to adsorption into the cellulose layer, while at the other two temperatures, due to the lack of proper adsorption, there are many fluctuations in the distance diagram, which confirms the above results.
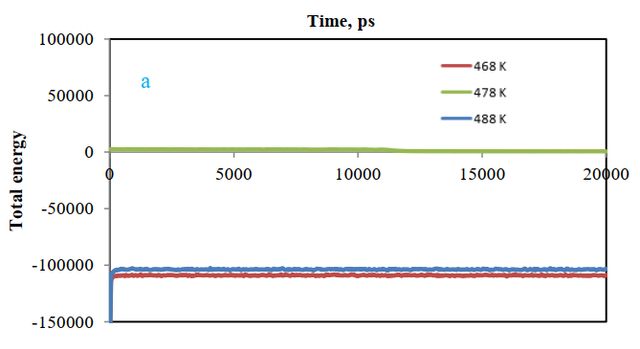
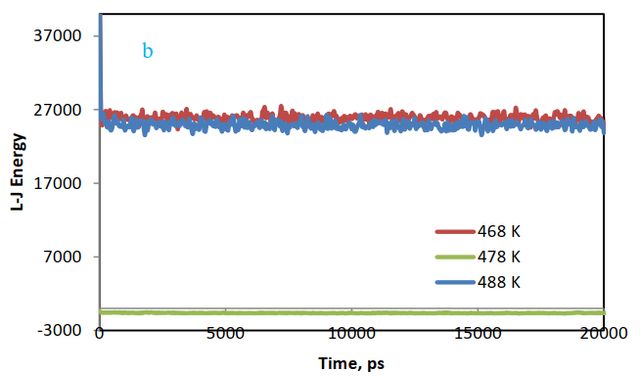
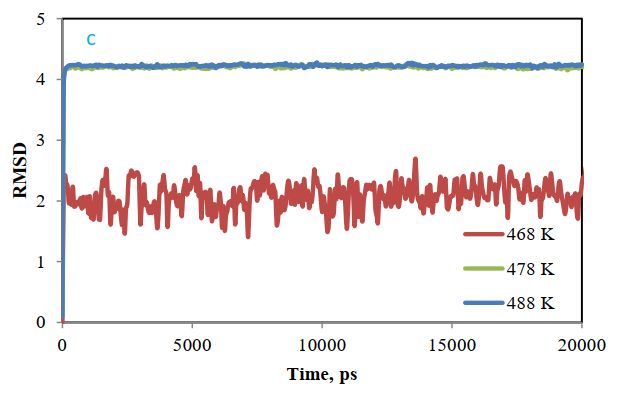
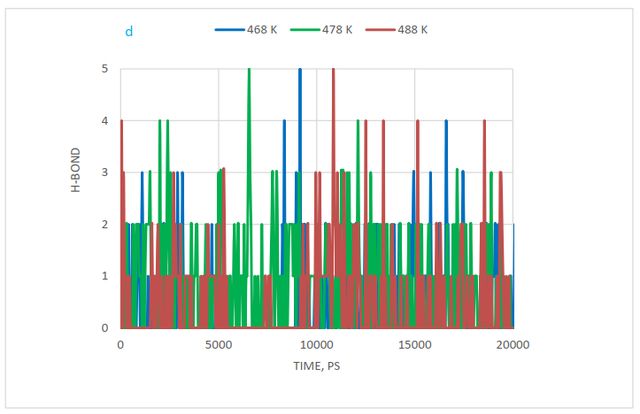
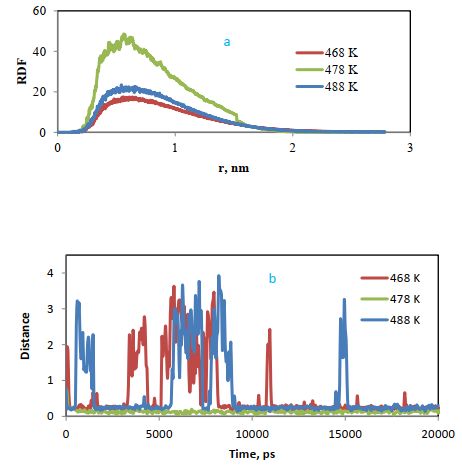
Figure 16 shows the styrene-acrylic mean square displacement (MSD) changes at three studied temperatures, and the results confirm the minimum square displacement or more styrene-acrylic shift to cellulose at 478 K. The diffusion coefficient can be calculated from the slope of this diagram. Table 4 shows the constant values of diffusion constant (DA). The slope of the MSD curve is greater for styrene-acrylic at 478 K, which shows the highest adsorption or diffusion.
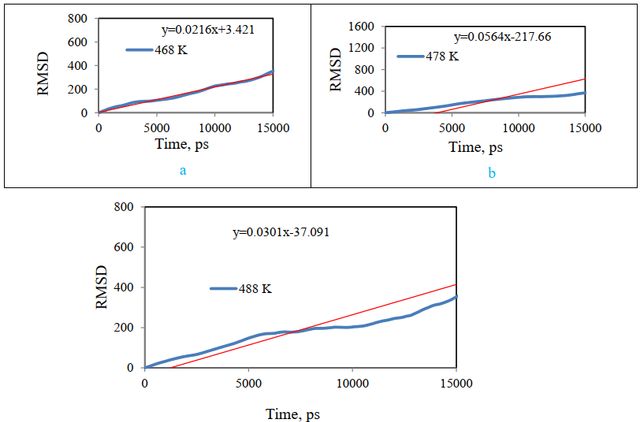
No. based on Table 2 | DA (nm2) pm–1 | Temperature, K |
1 | 0.0036 | 468 |
2 | 0.01 | 478 |
3 | 0.005 | 488 |
Desorption of styrene-acrylic from cellulose surface
In this section, two adsorption and desorption states have been compared. In one case, the system, including styrene-acrylic and cellulose, was simulated at 478 K, and the final result showed the best polymer adsorption on cellulose (absorbed state). Then, the final adsorbed system was used as the initial state for studying desorption, and the pull code was applied to it in Gromacs software (state of desorption). The results of these two modes are presented in Figure 17 (a). It compares the distance changes between styrene-acrylic and cellulose in the adsorption and desorption states. In the absorption diagram, the distance between the two compounds has decreased over time, while in the designed desorbed system, the distance between styrene-acrylic and cellulose has increased over time. The result confirms the occurrence of desorption.
The radial distribution function (RDF) of cellulose and styrene-acrylic in these two cases is compared in Figure 17 (b). It indicates the highest probability of the presence of two molecules for the adsorbed case, which confirms the result of the distance diagram.
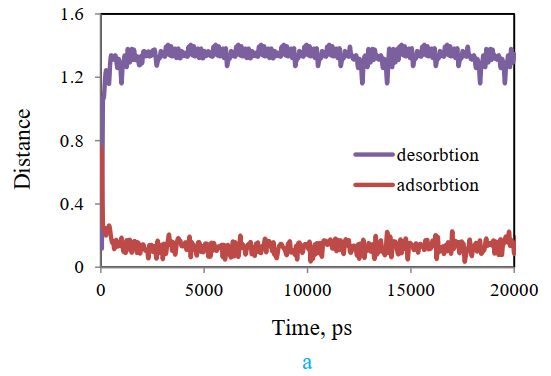
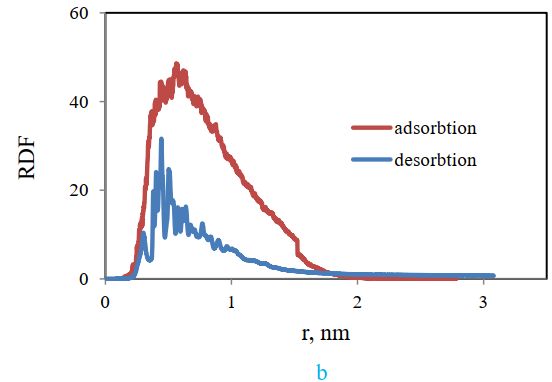
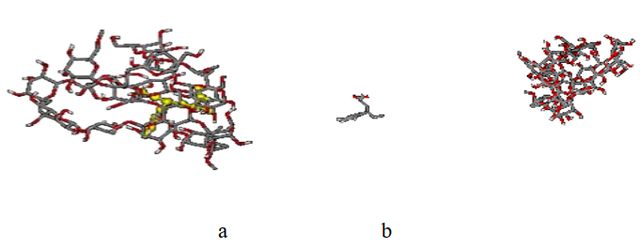
Figure 18 shows the snapshot picture obtained after 20 ns optimization for the two desorbed and adsorbed systems.
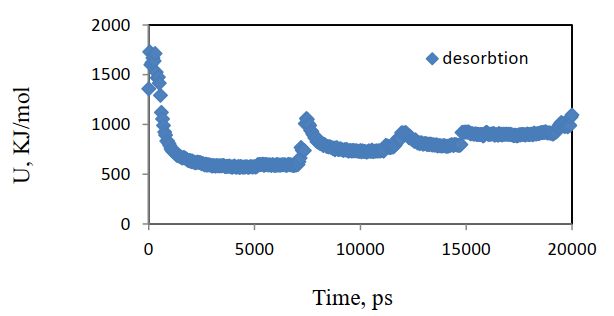
The potential energy change vs. time for the desorbed system is given in Figure 19.
Potential changes were drawn vs. distance for both adsorption and desorption states (Figure 20), and according to the following equation, adsorption, and desorption forces were compared from the slope of the graph.
\(F=-\frac{\partial U}{\partial r}\)
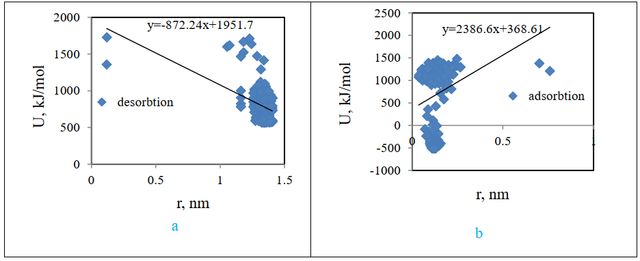
According to the above diagrams, the adsorption force is equal to 2386.6 kJ / mol.nm, and the desorption force is equal to 872.24KJ / mol.nm.
Conclusion
The synthesized toner with styrene polymer became similar to sand grains after drying. Large, uneven particles are generated that result from strong intermolecular forces that hold the styrene particles together. When printing with this toner, no particles were absorbed into the paper due to the lack of hydrogen in this molecule. The experimental results are also consistent with the theoretical results. Synthesized toner with acrylic has smaller particles than styrene after drying, which is due to the presence of weaker intermolecular forces than styrene and the presence of hydrogen in the molecule. Printing with this toner caused very little absorption on the paper, but the toner was cleared by drawing your hand on the paper due to the low hydrogen bond between the acrylic and the paper. The results of experimental experiments are confirmed by simulation. Acrylic molecules bind to paper molecules due to their hydrogen bonding, but the number of these bonds is not high. The synthesized toner with styrene-acrylic polymer was completely powdered after drying and is similar to the standard toner. After printing with this toner, the particles bonded to cellulose and adsorbed on paper. The printed paper with this toner could not be cleaned by hand. The styrene-acrylic molecule has a strong hydrogen bond with the cellulose molecule due to its high hydrogen content. These bonds cause the adsorption of toner on the paper. For this reason, styrene-acrylic polymer can be a proper option for synthesizing toners with mentioned physical characteristics.
Statements and Declarations
Authors' contributions
Davood Ajloo: Conceptualized the research design and edited the manuscript; Maryam Ghadamgahi: Performed computation and drafted the manuscript; Samane Farhadi: Experimenting and conducted data analysis and drafted the manuscript; Amir Sohrabi Sheikh Vaisi: Contributed to the performing experiment.
Competing Interests
The authors declare no competing interests.
Ethics approval
Not applicable.
Data availability
All data in the paper are available from the corresponding authors upon reasonable request.
Funding
No funding was received to support this work.
Acknowledgment
Financial support from the Research Council of Damghan University is acknowledged.
Authors’ Information
Samaneh Farhadi—School of Chemistry, Damghan University, Damghan, Iran;
Davood Ajloo—School of Chemistry, Damghan University, Damghan, Iran;
Maryam Ghadamgahi—School of Chemistry, Damghan University, Damghan, Iran.
Amir Sohrabi Sheikh Vaisi—School of Chemistry, Damghan University, Damghan, Iran.