
.jpg)
 - Copy copy.png)

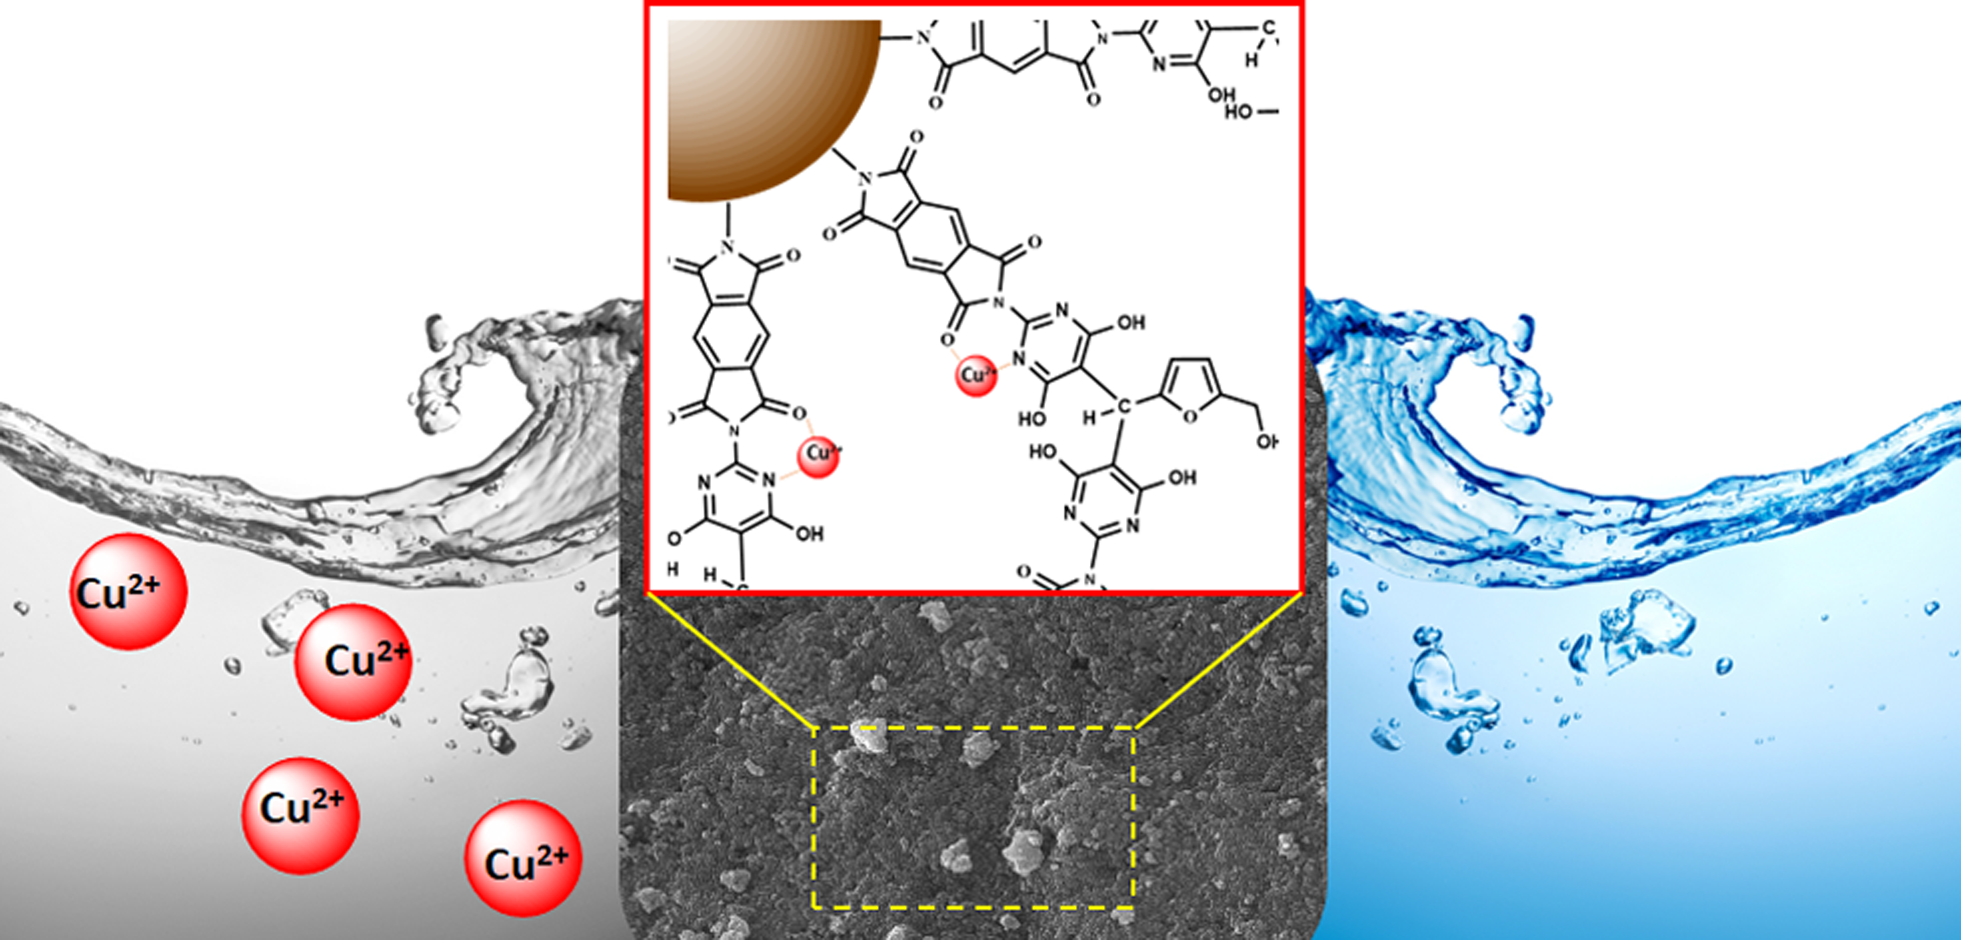
Visual Abstract
Abstract
This study presents the development of a novel poly(imide-pyrimidine)-derived magnetic nanocomposite for Cu(II) removal from aqueous solutions. A one-step solvothermal process was employed to fabricate the nanocomposite, combining a heat-resistant polymer backbone with magnetic iron nanoparticles. The expected functional groups were successfully incorporated into the surface of all composites. The incorporation of Fe3O4 was confirmed to be to the polymer matrix, which allowed its effective magnetic separation. The integration of Fe3O4 into the polymer matrix was confirmed, facilitating effective magnetic separation. Additionally, the performance of the nanocomposite for the removal of Cu(II) was assessed through batch adsorption experiments. Optimal conditions were identified using Response Surface Methodology, yielding a pH of 7, an adsorption time of 60 minutes, and an adsorbent dosage of 0.4 g/L. Under these conditions, the material demonstrated high efficiency in copper removal, particularly at lower concentrations. At 10 mg/L initial concentration, the nanocomposite achieved 99% removal with an adsorption capacity of 24.75 mg/g. This research contributes to the development of advanced materials for environmental remediation, showcasing the potential of engineered nanocomposites in addressing water pollution challenges.
Introduction
Wastewater that contains heavy metals is a significant environmental problem and a major concern for researchers due to its toxicity and negative health effects on humans [1–3]. Toxic metals can cause various diseases and ailments when they exceed specific limits [4,5]. These metals accumulate in living organisms and become more concentrated as they move up the food chain [6,7]. Copper (Cu(II)) is one of the commonly used heavy metals that can be a source of copper effluence, either currently or potentially [8]. Improper disposal of wastewater containing this toxic metal without adequate treatment is responsible for water quality degradation. The excessive presence of Cu(II) beyond the essential requirement can lead to health issues such as anemia, liver and kidney damage, and irritation of the stomach and intestines [8]. The USEPA has set a limit of 1.3 mg/L for Cu(II) in drinking water [9]. Chemical precipitation, membrane technology, ion exchange, electrolytic reduction, and adsorption are commonly used methods for treating water contaminated with metals [10–13]. Among these methods, adsorption has received significant attention due to its feasibility, simplicity, and effectiveness [14]. However, it also has a few limitations. Therefore, it is important to develop new advancements and alternatives for the treatment of toxic metals [15].
The development of advanced materials with enhanced thermal and mechanical properties is a critical area of research in polymer science and nanotechnology [16–18]. This study presents an innovative approach to synthesizing a novel heat-resistant nanocomposite, combining sophisticated polymer chemistry with cutting-edge nanotechnology. The research focuses on designing and preparing a unique nanocomposite material by polymerizing a carefully engineered monomer using an imidization reaction [19]. The study bridges organic polymer chemistry with inorganic nanomaterial science by exploiting the chemical versatility of the polymer structure [20,21]. The presence of lone electron pairs on nitrogen atoms in the polymer backbone allows for the creation of nanocomposites through reactions with active nanoparticles [22]. This approach is further enhanced by the incorporation of magnetic iron nanoparticles, synthesized through an in-situ, one-step solvothermal process, designed to create a strong bond between the organic polymer structure and the inorganic components [23–25]. The hypothesis is that the resulting nanocomposite will exhibit significantly higher thermal and mechanical resistance compared to conventional materials. This prediction is based on the expected synergistic effects from the combination of the heat-resistant polymer backbone, the reinforcing aromatic structures, and the thermal stability contributed by the iron nanoparticles.
In addition to its material science aspects, this study explores the potential environmental applications of the synthesized nanocomposite, particularly in the removal of metal ions from aqueous solutions [26–28]. The research investigates the use of both the synthesized poly(imide-pyrimidine) and the magnetic nanocomposite for the adsorption of Cu(II) ions from water, employing solid-liquid extraction techniques and mathematical adsorption models to quantify the material’s effectiveness.
At the core of this investigation is the strategic design of a monomer structure incorporating a pyrimidine group, enhanced by polar hydroxyl groups. This design aims to improve the solubility of the resulting polymer, facilitating its processing and application. The polymer’s main chain is further strengthened by the inclusion of aromatic rings, a feature known to significantly contribute to both thermal and mechanical stability.
This multifaceted research not only contributes to the advancement of high-performance polymer nanocomposites but also addresses the pressing environmental concern of metal ion contamination in water sources. The study’s outcomes have potential implications for various fields, including materials science, environmental remediation, and industrial applications requiring materials with exceptional thermal and mechanical properties.
Materials and methods
Materials and instrumental
5-(Hydroxymethyl) furfural (≥99%, Sigma-Aldrich), 2-Amino–4,6-dihydroxypyrimidine (98%, Sigma-Aldrich), Dimethyl sulfoxide (DMSO, ≥99.9%, Merck KGaA), Pyromellitic dianhydride (PMDA, 97%, Merck KGaA), N, N-Dimethylacetamide (DMAc, ≥99%, Merck KGaA), Triethylamine (TEA, ≥99%, Merck KGaA), Ethylene glycol (EG, ≥99.5%, Merck KGaA), Iron(III) chloride hexahydrate (FeCl3·6H2O, ≥98%, Merck KGaA), Acetone (≥99.5%, Merck KGaA), n-Hexane (≥95%, Merck KGaA), Pyridine (Py, ≥99%, Sigma-Aldrich), Acetic anhydride (Ac2O, ≥98%, Merck KGaA), N-Methyl–2-pyrrolidone (NMP, 99%, Sigma-Aldrich), Copper sulfate pentahydrate (CuSO4·5H2O, ≥98%, Merck KGaA). All reagents and solvents used in this study were of analytical grade and utilized as received.
Nuclear Magnetic Resonance (NMR) spectroscopic analysis was conducted utilizing a Bruker Avance DPX500 spectrometer at Mazandaran University. 1H and 13C NMR spectra were acquired at 400 MHz and 100 MHz, respectively, under ambient conditions (25 ± 1 °C). Deuterated dimethyl sulfoxide (DMSO-d6, 99.9 atom % D) was employed as the solvent medium. Polymer samples were carefully selected based on optimal solubility within each experimental series and subjected to rigorous purification protocols before analysis.
Vibrational spectroscopic characterization was performed via Fourier Transform Infrared (FT-IR) spectroscopy using a Perkin Elmer Spectrum Two instrument. Spectra were recorded in the mid-infrared region (4000–400 cm–1) with a spectral resolution of 4 cm–1.
Nanostructural analysis was conducted using Transmission Electron Microscopy (TEM) to elucidate the size distribution and spatial arrangement of nanoparticles within the polymer matrix. A Carl Zeiss model 906E EO TEM, operating at an acceleration voltage of 80 kV, was employed for this purpose.
The magnetic properties of the iron nanoparticles were evaluated using a Vibrating Sample Magnetometer (VSM) manufactured by Maghnatiss Daghigh Kavir Kashan Company. Magnetization measurements were performed at room temperature with a maximum applied field strength of ±20 kOe.
Surface morphology was investigated via Scanning Electron Microscopy (SEM) using a MIRA3TESCAN-XMU microscope at the Razi Metallurgy Laboratory. Before imaging, samples were sputter-coated with gold to enhance surface conductivity and improve image quality.
Crystallographic analysis was performed using X-ray Diffraction (XRD) on a PHILIPS PW1730 diffractometer with Cu Kα radiation (λ = 1.5418 Å). The instrument was operated at 40 kV and 30 mA, with diffraction patterns recorded over a 2θ range of 10–80°, using a step size of 0.02° and a scan rate of 2° min–1.
Thermal stability was assessed through Thermogravimetric Analysis (TGA) using a Perkin Elmer Thermal Analyzer under an inert nitrogen atmosphere. Samples (5–10 mg) were subjected to a controlled temperature ramp from 30 to 800 °C at a heating rate of 10 °C min–1.
Experimental
Diamine monomer synthesis
The diamine monomer was synthesized solvothermal by condensing 1mL (0.01 mol) of 5-(hydroxymethyl) furfural and 2.6 g (20 mmol) of 2-amino–4,6-dihydroxy pyrimidine in dimethyl sulfoxide [29–31]. The heterogeneous mixture in a round-bottom flask equipped with a condenser and magnetic stirrer was heated to reflux at 150°C for 12 hours. A prominent color change from white to orange to black was observed during reflux. After cooling, the black product suspension was poured into an ice bath for precipitation over 10–15 minutes. The organic phase was separated in the next step, and the black powder was collected by rotary and dried in a vacuum oven at 100 °C. The compound did not have a distinct melting point and broke down upon heating over 350 °C. The yield of the process was around 89% (3.3 g). In Figure 1, the synthetic path is displayed.
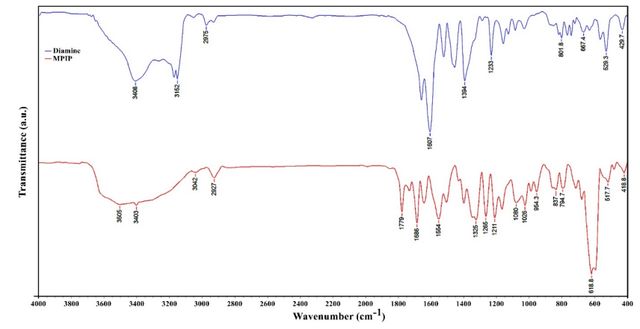
FT-IR (KBr disk) at cm–1: 3408 (OH), 3170–3152 (NH2), 3051 (C-H aromatic), 2975–2932 (C-H aliphatic), 1657 (C = N), 1607 (C = C), 1233 (C-N), and 1159 (C-O). 1H NMR (DMSO-d6, δ in ppm): 2.69 (s, 1H, OH), 4.40 (s, 2H, CH2), 5.20 (s, 1H, C-H), 6.58–6.60 (d, 1H, Ar-H, J = 8.0 Hz), 6.70 (s, broad, 4H, NH2), 6.83–6.85 (d, 1H, Ar-H, J = 8 Hz), 10.28–10.46 (m, 4H, broad, -OH). 13C NMR (100 MHz, DMSO-d6, δ in ppm): 30.88, 54.46, 106.10, 107.62, 111.23, 143.79, 151.48, 153.23, 172.42. Elemental analysis calculated for C14H14N6O6: C, 46.41%; H, 3.87%; N, 23.20% and found: C, 46.35%; H, 3.98%; N, 23.02%.

Polyamic acid and polyamic acid salt synthesis
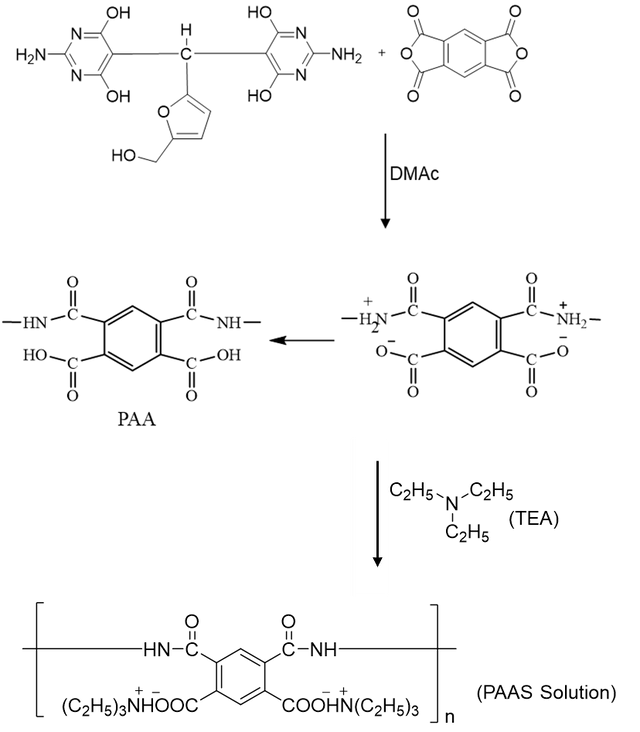
In N, N-dimethylacetamide (DMAc) solvent, a polymerization reaction between the diamine monomer and pyromellitic dianhydride (PMDA) produced the polyamic acid [32,33]. Typically, a beaker holding 25 mL of anhydrous DMAc was charged with 0.2 g (0.45 mmol) of the diamine and 0.1 g (0.45 mmol) of PMDA in an inert environment. To promote the synthesis of polyamic acid (PAA), the heterogeneous reaction mixture was magnetically agitated for four hours at room temperature. After the reaction time was up, a viscous PAA solution was produced.
To create the polyamic acid salt (PAAS), 0.2 mL of triethylamine was added to a viscous PAA solution as an imidization catalyst. The mixture was then left to equilibrate at room temperature for four hours in an inert atmosphere, which helped to promote the creation of the salt [34]. Figure 2 shows the synthesis process for PAA and PAAS.
Preparation of the magnetic poly(imide-pyrimidine)@Fe3O4 nanocomposite
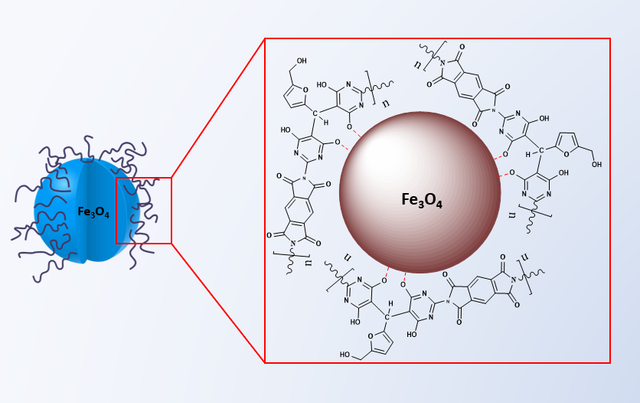
The magnetic poly(imide-pyrimidine)@Fe3O4 nanocomposite (MPIP) was fabricated via a one-step solvothermal approach [35,36]. The as-synthesized PAAS was dissolved in a solvent mixture comprising 10 mL of N, N-dimethylacetamide, and 10 mL of ethylene glycol in a round-bottom flask. Concurrently, an iron precursor solution was prepared by dissolving 1.35 g of anhydrous ferric chloride in 10 mL of ethylene glycol. After 1 hour of equilibration, the iron precursor solution was transferred to the polymer solution, yielding a homogeneous reaction mixture. This mixture was then sealed in a Teflon-lined stainless-steel autoclave and subjected to solvothermal treatment at 200 °C for 8 hours Figure 3.
The preparation of the poly(imide-pyrimidine) derived from the new diamine monomer via condensation polymerization
Through a two-step condensed polymerization process, the poly(imide-pyrimidine) (PIP) derived from the new diamine monomer was created [36–39]. The PAA intermediate was made by reacting 0.2g (0.45 mmol) of the diamine monomer with 0.1g (0.45 mmol) of pyromellitic dianhydride (PMDA) in N-methyl–2-pyrrolidone (NMP) at room temperature for two hours in a 50 mL round-bottom flask with a magnetic stirrer in a nitrogen atmosphere. To promote cyclodehydration and the production of imide rings, pyridine, and acetic anhydride were added as oxidizing agents, and the reaction mixture was heated to 120 °C for three hours. To obtain the desired polymer as a dark brown solid, the resultant PIP was precipitated in methanol, filtered, cleaned with hot water, and dried under vacuum (Figure 4).
PIP: FT-IR (KBr disk) at cm–1: 3505 (OH), 3403 (NH), 3042 (C-H aromatic), 2927 (C-H aliphatic), 1657 (C = N), 1779 (C = O), 1686 (C = C), 1211 (C-N), 1080 (C-O) and 619 (Fe-O). 1H NMR (DMSO-d6, δ in ppm): 2.72 (s, 1H, OH), 4.04 (s, 2H, CH2), 5.21 (s, 1H, C-H), 6.73–6.75 (d, 1H, Ar-H, J = 8.0 Hz), 7.17–7.19 (d, 1H, Ar-H, J = 8 Hz), 8.17 (s, 2H, Ar-H), 11.96 (s, 4H, broad, -OH).

Application of the magnetic poly(imide-pyrimidine)-derived nanocomposite for removal of Cu(II) ions
Cu(II) ion solution preparation
To simulate Cu(II) -contaminated wastewater, a stock solution with an initial Cu(II) concentration of 1000 mg/L was prepared by dissolving an appropriate amount of Cu(II) sulfate pentahydrate (CuSO4·5H2O) in deionized water [40,41]. This stock was subsequently employed to obtain test solutions of desired lower concentrations through dilution with deionized water. The copper salt was selected due to its high solubility and purity, ensuring the preparation of homogeneous solutions suitable for systematic evaluation of the adsorbent’s removal performance under controlled conditions. Precise dilution factors were calculated based on the target concentrations to maintain consistency and reliability across the experimental trials investigating the effects of various parameters on the Cu(II) adsorption process.
Cu(II) adsorption process optimization
To optimize the influential parameters on Cu(II) removal and model the adsorption process, Response Surface Methodology (RSM) coupled with a Box-Behnken design (BBD) was implemented using Design-Expert software (version 7) [42]. The three independent variables investigated were: (A) pH, (B) adsorption time, and (C) adsorbent dosage. This study designated the Cu(II) removal percentage (%R) as the response variable.
The experimental ranges of the influential parameters in the BBD for Cu(II) removal from aqueous media are presented in Table 1. Both the PIP and MPIP were evaluated as adsorbents. For each experimental run, 50 mL of a 50 mg/L Cu(II) solution was treated under the designated conditions of the specific variable combination. Following RSM principles, a second-order polynomial model was selected as the most appropriate for predicting the responses.
The regression coefficients were calculated to establish an empirical relationship between the total Cu(II) removal percentage (R%) and the influential parameters. The resulting second-order polynomial equations, relating the coded values of the independent variables to the response, are provided by equations (1) and (2) for the PIP and MPIP adsorbents, respectively.
The models' statistical significance and goodness of fit were assessed using the R-squared, adjusted R-squared, and predicted R-squared values, summarized in Table 1.
Variable | Symbol | Coded factor level | ||
-1 | 0 | 1 | ||
pH | A | 2 | 5 | 8 |
Adsorption time (min.) | B | 10 | 50 | 90 |
Adsorbent dosage (g/L) | C | 0.1 | 0.3 | 0.5 |
Therefore, this model was employed to obtain the response as a function of independent variables and their interactions. This way, the response above has been predicted using a polynomial equation (Equation (1)).
\(\mathrm{Y}= \beta _0+\sum\limits_{\mathrm{i}=1}^{\mathrm{k}}\beta _{\mathrm{i}}\mathrm{X}_{\mathrm{i}}+\sum\limits_{\mathrm{i}=1}^{\mathrm{k}}\beta _{\mathrm{i}\mathrm{i}}\mathrm{X}^{2}+\sum\limits_{\mathrm{i}=1}^{\mathrm{k}-1}\sum\limits_{\mathrm{j}=2}^{\mathrm{k}}\beta _{\mathrm{i}\mathrm{j}}\mathrm{X}_{\mathrm{i}}\mathrm{X}_{\mathrm{i}\mathrm{j}}\)
Consequently, this model is applied in this equation, where \(\beta\) denotes the regression coefficient, to derive the expected response Y as a function of independent variables and interactions. The parameters’ encoded values are Xi and Xj. The empirical relationship between the effective parameters and the overall Cu(II) adsorption percentage (R%) was deciphered by computing the regression coefficient. The PIP and MPIP nanocomposite adsorbents are the subjects of mathematical connections 1 and 2, respectively.
Mathematical connection 1:
\(\begin{align} R= &+75.60+20.25A+18.75B+13.00C+18.75AB+5.25AC+5.75BC−28.92A^{2}\\&−25.92B^{2}−8.43C^{2} \end{align}\)
Mathematical connection 2:
\(\begin{aligned}R=&+94.00+23.25A+23.13B+15.63C+21.50AB+3.00AC+3.25BC−32.63A^{2}\\&−31.87B^{2}−6.38C^{2}\end{aligned}\)
The value of \(R\) represents the percentage of Cu(II) removal, while the effective parameters A, B, and C correspond to pH, removal time, and adsorbent dosage, respectively. The R-squared value indicates how well the experimental data matches the appropriate model. The values of predicted R-squared and Adj R-squared, adjusted for the adsorbents, are provided in Table 5.
Kinetic study of Cu(II) ion adsorption
A kinetic study investigated the removal percentage of Cu(II) from an aqueous medium by varying the contact time. The optimum values of influential parameters in adsorption, obtained via the Box-Behnken Design (BBD) in Response Surface Methodology (RSM) for both adsorbents, are presented in Table 2.
Adsorbent | Time (min.) | pH | Dosage (mg/L) |
PIP | 60 | 7 | 0.4 |
MPIP | 60 | 7 | 0.4 |
Pseudo-first and second-order kinetic models were employed to analyze Cu(II) adsorption rates over time. These models, expressed linearly in equations (4) and (5), evaluate kinetic parameters:
\(\ln(Q_e-Q_t)=\ln(Q_e)-K_1t\)
\(\frac{t}{Q_t}=\frac{1}{K_2Q_e^2}+\frac{t}{Q_e}\)
Where \(Q_e\) and \(Q_t\) represent adsorbed analyte quantities at equilibrium and time \(t\), respectively. \(K_1\) and \(K_2\) are rate constants.
Cu(II) Ion removal experiments
0.1 g of the magnetic nanocomposite adsorbent was dispersed in 25 mL of the artificial Cu(II) solution to conduct batch adsorption studies. To achieve balance, the suspension was stirred for an hour at 60 rpm with a magnetic stirrer. Following adsorption, vacuum filtration was used to separate the adsorbent. Atomic absorption spectroscopy (AAS) was used to measure the residual Cu(II) contents in the filtrates to assess the removal effectiveness. A thorough evaluation of the nanocomposite’s performance under the given batch conditions was made possible by the evaluation of the adsorption capacity from both the initial and equilibrium concentrations.
Analysis of data
We used a one-way analysis of variance (ANOVA) with Chaffe’s post hoc test to determine the statistical significance of differences between the outcomes of the examined groups. When the p-value was under the threshold of 0.05 (p<0.05), differences were considered statistically significant.
Results and discussion
The characteristic of the prepared nanocomposite
FT-IR analysis
Diamine compound
The structural analysis of the diamine compound was conducted using various spectroscopic techniques. FT-IR spectroscopy revealed characteristic peaks, including a hydroxyl group at 3408 cm–1 and amine group stretching vibrations at 3170 cm–1 and 3151 cm–1 (Figure 5). The 13C NMR spectrum exhibited nine distinct signals, with the most deshielded carbon appearing at 172.42 ppm. The elemental analysis confirmed the compound’s composition, with experimental values closely matching the calculated percentages for C14H14N6O6 (Figure S1). The 1H NMR spectrum provided further structural insights, showing a singlet at 2.69 ppm for the hydroxyl proton and a broad signal at 6.70 ppm representing the amine protons. Aromatic protons were observed as doublets at 6.58–6.60 ppm and 6.83–6.85 ppm, both with a coupling constant of 8 Hz. These comprehensive spectroscopic data collectively support the proposed structure of the diamine compound (Figure S2).
Poly(imide-pyrimidine)@Fe3O4 nanocomposite
The FT-IR spectrum reveals a characteristic absorption band at 619 cm–1, indicative of Fe-O stretching vibrations, confirming the integration of Fe3O4 nanoparticles within the composite structure. Furthermore, the presence of peaks at 1657 cm–1 and 1779 cm–1, attributed to C = N and C = O stretching respectively, substantiates the existence of imide and carbonyl groups in the PIP matrix (Figure 5). Complementing these findings, the 1H NMR spectrum elucidates the molecular structure of MPIP, with distinct signals observed at δ 2.72 ppm (OH), 4.04 ppm (CH2), and 5.21 ppm (C-H). The aromatic region shows characteristic doublets at 6.73–6.75 ppm and 7.17–7.19 ppm (J = 8 Hz), alongside a singlet at 8.17 ppm, confirming the presence of aromatic moieties. The broad signal at 11.96 ppm, integrating four protons, further corroborates the existence of hydroxyl groups within the nanocomposite structure (Figure S3).
These spectroscopic analyses provide strong evidence for the formation of the desired MPIP nanocomposite structure, demonstrating the effective integration of magnetic nanoparticles within the polymer framework.
Code | T5 (oC)a | T10 (oC)b | C. Y.c | LOI (%)d |
PIP | 157 | 247 | 19 | 25 |
MPIP | 332 | 366 | 46 | 36 |
a T5% was recorded by TGA at 10 °C/min in N2.b T10% was recorded by TGA at 10 °C/min in N2.c C.Y.= Char yield, weight% of material left at 800 °C in N2.d Limiting oxygen index percent evaluating at char yield 800 °C. | ||||
Vibrating sample magnetometry analysis
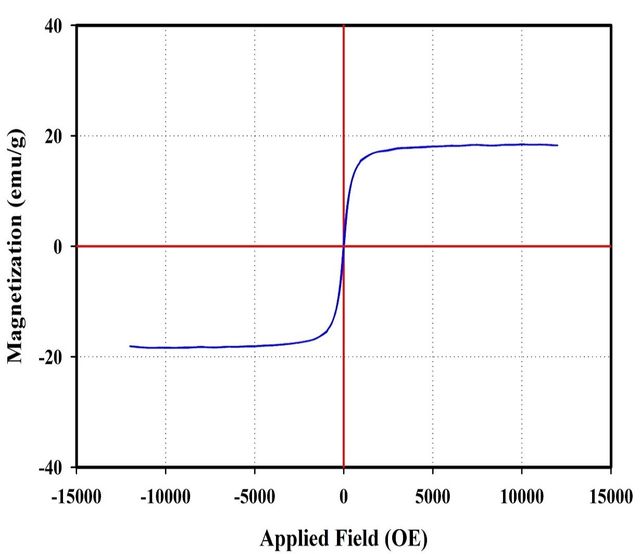
The magnetic properties of the MPIP nanocomposite were evaluated using Vibrating Sample Magnetometry (VSM). Figure 6 illustrates the magnetization curve of the nanocomposite. Results indicate a reduction in the magnetization of the MPIP nanocomposite compared to pure Fe3O4 nanoparticles. This decrease in magnetic response is primarily attributed to the PIP coating on the nanoparticle surface. The polymer shell effectively dilutes the magnetic content per unit mass, reducing magnetization. Despite this reduction, the nanocomposite retains significant magnetic properties, demonstrating the successful incorporation of magnetic nanoparticles within the polymer matrix while maintaining their magnetic functionality.
Differential thermogravimetry and thermogravimetric analysis
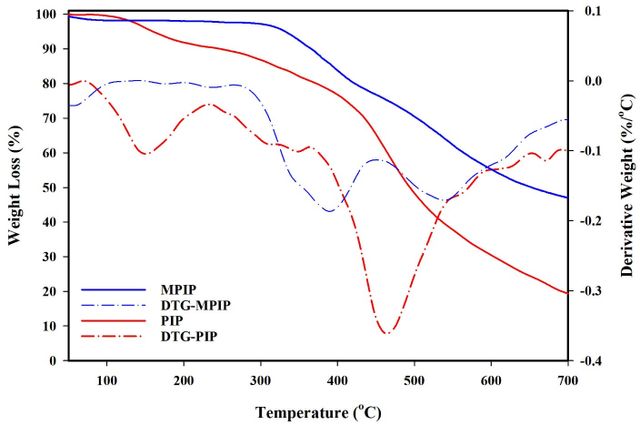
The thermal properties of selected PIPs and their magnetic nanocomposite were evaluated using TGA/DTG analysis under nitrogen (Figure 7). The study focused on weight loss at 5% and 10% (T5, T10) and residual mass at 800 °C (char yield). Notably, char yield serves as an indicator for estimating the limiting oxygen index (LOI) of polymers, calculated using the Van Krevelen and Hoftyzer equation: LOI = 17.5 + 0.4CR, where CR represents char yield (Table 3) [43].
For MPIP, the calculated LOI values exceeded 28, classifying these macromolecules as self-extinguishing. The incorporation of Fe3O4 nanoparticles into the PIP resulted in significant improvements in thermal stability. The T10 value increased from 247 °C for pure PIP to 366 °C for MPIP, while the char yield rose from 19% to 46% under nitrogen atmosphere.
This comparative analysis demonstrates the enhanced thermal resistance of the nanocomposite, highlighting the beneficial interaction between the Fe3O4 nanoparticles and the PIP. These findings underscore the potential of MPIP for applications requiring superior thermal properties.
This comparative analysis demonstrates the enhanced thermal resistance of the nanocomposite, highlighting the beneficial interaction between the Fe3O4 nanoparticles and the PIP. These findings underscore the potential of MPIP for applications requiring superior thermal properties.
The difference in char yield between MPIP and PIP (46% - 19% = 27%) could be attributed to the presence of Fe₃O₄ nanoparticles, as inorganic materials like iron oxides typically remain stable at 800 °C.
XRD analysis
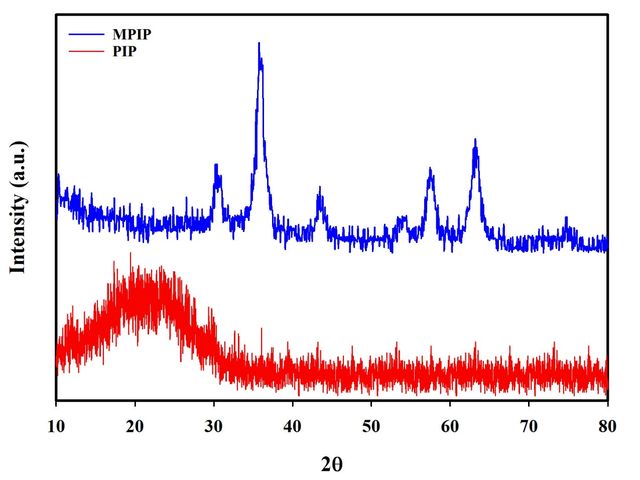
To look into the crystalline structure and particle size of the nanomaterials, an X-ray diffraction (XRD) examination was used. The XRD pattern of pure PIP is seen in Figure 8A, where a large peak that suggests the material’s amorphous nature is present. In contrast, the XRD spectrum of the MPIP, shown in Figure 8B, exhibits sharp, intense peaks, revealing a crystalline structure. This marked difference in diffraction patterns confirms the successful incorporation of Fe3O4 nanoparticles within the PIP matrix, transforming the material’s structural characteristics from amorphous to partially crystalline. The observed peaks in the nanocomposite’s XRD pattern correspond to the crystalline phases of Fe3O4, validating the presence and crystallinity of the magnetic nanoparticles.
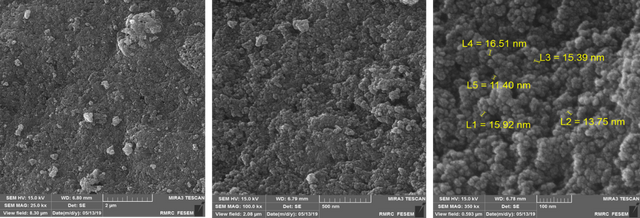
SEM analysis
Scanning Electron Microscopy (SEM) is a crucial tool in nanotechnology for analyzing material morphology. SEM analysis of the MPIP nanocomposite, presented in Figure 9, reveals key structural insights. The images demonstrate the shape, size, and distribution of particles on the sample surface. Notably, the micrographs indicate a homogeneous dispersion of Fe3O4 nanoparticles within the poly(imide-pyrimidine) matrix. This uniform distribution is evident from the consistent appearance of nanoscale features across the polymer surface. The observed morphology confirms successful nanocomposite formation, with Fe3O4 particles well-integrated into the PIP structure, suggesting effective synthesis procedures and potentially enhanced material properties due to the nano-scale interactions between the polymer and magnetic particles.
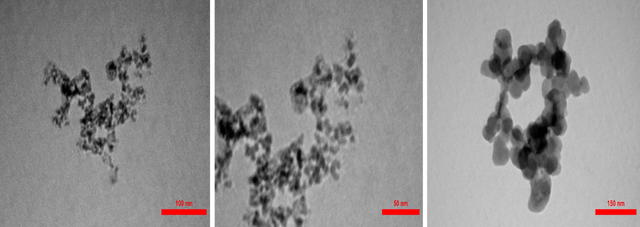
TEM analysis
The Transmission Electron Microscope (TEM) reveals the dimensions of nanoparticles and the uniformity of nanoparticle dispersion in the polymer network, and, naturally, uniform dispersion of nanoparticles in the polymer network yields the best results. The TEM images related to the MPIP nanocomposite are shown in Figure 10. The presence of dark spots indicates the placement of magnetic Fe3O4 nanoparticles as the core within a core-shell structure.
Cu(II) Adsorption
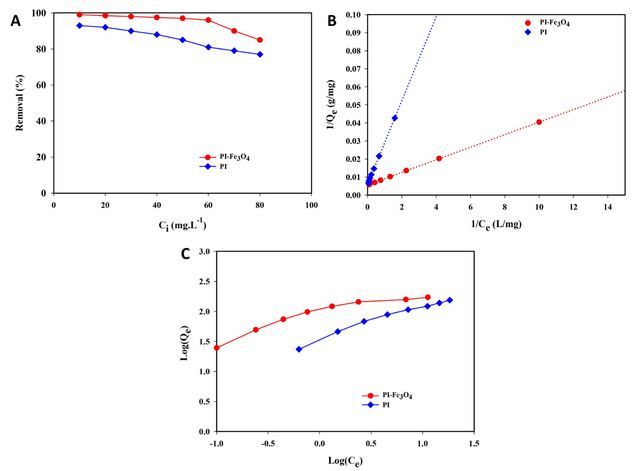
Study of Cu(II) adsorption isotherm
Figure 11A illustrates the effect of initial Cu(II) concentration on the equilibrium adsorption isotherm under optimal conditions, ranging from 10–80 mg/L. For the MPIP nanocomposite adsorbent (0.4g), Cu(II) removal is nearly complete at 10 mg/L initial concentration (R = 99%, Q = 24.75 mg/g). However, at higher concentrations, the removal percentage decreases while Qe increases. For instance, at 50 mg/L, Cu(II) removal reaches 97% with Qe of 121.69 mg/g, and at 60 mg/L, 96% removal with Qe of 144.02 mg/g. The MPIP nanocomposite demonstrates superior performance at lower Cu(II) concentrations compared to PIP adsorbent alone. You can see a comparison table of the maximum adsorption capacity (Qm) for Cu(II) removal, comparing this study’s results with those from the literature (Table 4).
Adsorbent | Qe (mg/g) | Experimental Conditions | Reference |
Poly(imide-pyrimidine)@Fe₃O₄ nanocomposite | 144.02 | pH 7, 60 min., 60 mg/L initial Cu(II) | This study |
Magnetic chitosan/graphene oxide composite | 84.46 | pH 5.5, 25°C, 50–300 mg/L Cu(II) | [29] |
Fe₃O₄@SiO₂-NH₂ nanoparticles | 51.81 | pH 6, 25°C, 10–100 mg/L Cu(II) | [30] |
Magnetic cellulose-chitosan composite | 78.13 | pH 5.5, 30°C, 50–250 mg/L Cu(II) | [31] |
Amino-functionalized magnetic nanoparticles | 25.77 | pH 6, 25°C, 10–100 mg/L Cu(II) | [32] |
Optimized results for Cu(II) adsorption
It can be concluded from Table 5's R-squared values for the adsorbents that the experimental data and the software model agree quite well. Furthermore, there is strong agreement between the predicted and observed values for the percentage of total Cu(II) removal, as evidenced by the proximity of the predicted R-squared and adjusted R-squared values.
Adsorbent | R-squared | Adjusted R-squared |
PIP | 0.9996 | 0.9992 |
MPIP | 0.9990 | 0.9978 |
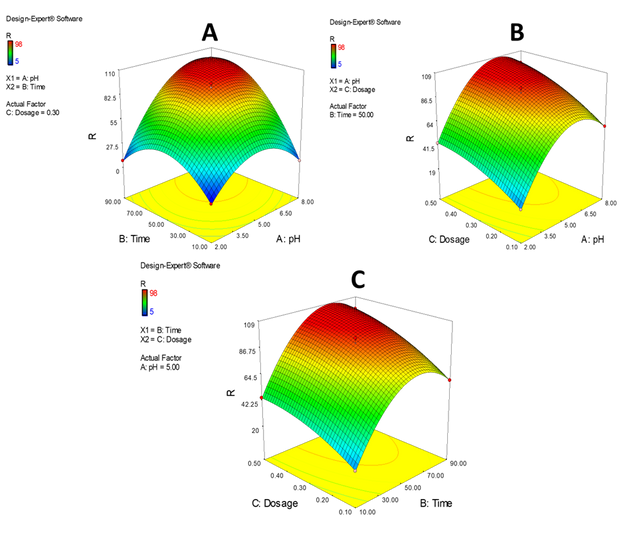
Figure 12 presents a comprehensive analysis of Cu(II) adsorption using a poly(imide-pyrimidine)@Fe3O4 nanocomposite adsorbent. The 3D surfaces illustrate the interplay between key parameters: adsorption time, pH, and adsorbent dose. The study reveals optimal conditions for Cu(II) removal:
i) 60 minutes of adsorption time, after which efficiency plateaus
ii) pH 7, with removal increasing from pH 2–7 and stabilizing at pH 6–7
iii) 0.4g adsorbent dose, beyond which removal efficiency stabilizes
Rapid initial adsorption was attributed to abundant adsorption sites, followed by a decrease due to gradual site occupation. Higher adsorbent doses weren’t used to prevent agglomeration. These optimal parameters (pH 7, 60 minutes, 0.4g adsorbent) were determined using Response Surface Methodology (RSM) for the MPIP nanocomposite adsorbent in Cu(II) removal from aqueous solutions.
Kinetic study of Cu(II) adsorption
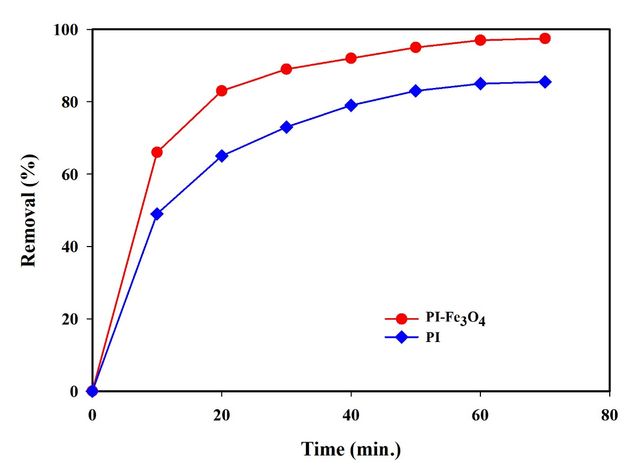
For the poly(imide-pyrimidine) adsorbent, Cu(II) removal increased rapidly in the first 60 minutes, after which no significant increase was observed. Similarly, the MPIP nanocomposite adsorbent showed a rapid increase in Cu(II) removal during the initial 60 minutes, followed by a plateau. Consequently, 60 minutes was established as the equilibrium time for both adsorbents.
Figure 13 illustrates the Cu(II) removal efficiency over time for two adsorbents, with an initial Cu(II) concentration of 50 mg/L in the stock solution. The graph depicts the percentage of total Cu(II) removal versus time for both adsorbents.
Tables 6 and 7 present the first-order and second-order kinetic model parameters for Cu(II) removal by both adsorbents, respectively. The data includes R² values, Q (calculated adsorption capacity), rate constants (K1 and K2), Qexp (experimental adsorption capacity), and percentage deviation.
Ci (mg/L) | Parameters | PIP | MPIP |
R2 | 0.9872 | 0.9852 | |
50 | Q | 131.47 | 95.67 |
K1 | 0.068 | 0.074 | |
Qexp | 106.25 | 121.69 | |
Deviation (%) | 19.2 | –21 |
Ci (mg/L) | Parameters | PIP | MPIP |
R2 | 0.9998 | 0.9998 | |
50 | Q | 123.45 | 133.3 |
K2 | 0.097 | 0.174 | |
Qexp | 106.25 | 121.69 | |
Deviation (%) | 13.9 | 8.7 |
Analysis of these tables reveals that the Qe value for the pseudo-second-order model shows less deviation from experimental data compared to the first-order model. This suggests that the pseudo-second-order mechanism aligns more closely with the Cu(II) removal process for both adsorbents. The higher R² values (0.9998) for the second-order model further support this conclusion.
Conclusions
This study presents the successful synthesis and characterization of a novel poly(imide-pyrimidine)-derived magnetic nanocomposite via a one-step solvothermal process. The research demonstrates the effective integration of Fe₃O₄ nanoparticles within the Poly(imide-pyrimidine), resulting in a nanocomposite with significantly enhanced thermal stability compared to the pure polymer.
Thermogravimetric analysis revealed a substantial improvement in thermal properties, with the temperature at 10% weight loss (T10) increasing from 247 °C for pure PIP to 366 °C for MPIP. Moreover, the char yield at 800 °C increased from 19% to 46% under a nitrogen atmosphere, indicating a remarkable enhancement in thermal resistance. The calculated Limiting Oxygen Index (LOI) of 36% for MPIP classifies it as a self-extinguishing material, highlighting its potential for flame-retardant applications.
The MPIP nanocomposite exhibited exceptional efficiency in Cu(II) ion removal from aqueous solutions. At an initial Cu(II) concentration of 10 mg/L, the nanocomposite achieved 99% removal with an adsorption capacity of 24.75 mg/g. Even at higher concentrations, the material maintained high efficiency, with 97% removal (121.69 mg/g) at 50 mg/L and 96% removal (144.02 mg/g) at 60 mg/L. Response Surface Methodology (RSM) identified optimal conditions for copper removal: pH 7, 60 minutes of adsorption time, and 0.4 g/L adsorbent dosage.
Kinetic studies revealed that the adsorption process aligns closely with a pseudo-second-order model (R² = 0.9998), providing insights into the mechanism of copper removal. The calculated adsorption capacity (Q) from this model (133.3 mg/g) showed only an 8.7% deviation from the experimental value (121.69 mg/g), further validating the model’s accuracy.
These findings significantly contribute to the field of advanced materials for environmental applications, demonstrating the potential of engineered nanocomposites in addressing water pollution challenges. The MPIP nanocomposite’s superior performance in heavy metal removal, coupled with its enhanced thermal properties, opens avenues for its application in various industrial and environmental contexts.
Future research directions should explore the nanocomposite’s efficacy with other heavy metals, investigate its reusability over multiple adsorption-desorption cycles, and develop scale-up strategies for industrial implementation. Additionally, mechanistic studies to elucidate the precise nature of the Cu(II)-nanocomposite interactions could provide valuable insights for further material optimization. This work advances the field of nanocomposite-based environmental remediation technologies, offering a promising solution for sustainable water treatment practices.
Statements and Declarations
Authors' contributions
N. Ghanbari: Data curation, Investigation and Methodology. M. Taghavi: Supervision, Conceptualization of Ideas, Validation, Formal analysis, Writing - Review & Editing of original Manuscript. All authors reviewed the manuscript.
Competing interests
The authors declare no competing interest.
Ethics approval
Not applicable.
Data availability
Data will be made available on request.
Funding
No funding was received to support this work.
Acknowledgment
The authors acknowledge Shahid Chamran University of Ahvaz for financial support.
Authors’ Information
Neda Ghanbari—Department of Chemistry, Faculty of Science, Shahid Chamran University of Ahvaz, Ahvaz, Iran;
Mehdi Taghavi—Department of Chemistry, Faculty of Science, Shahid Chamran University of Ahvaz, Ahvaz, Iran;