
.jpg)
 - Copy copy.png)

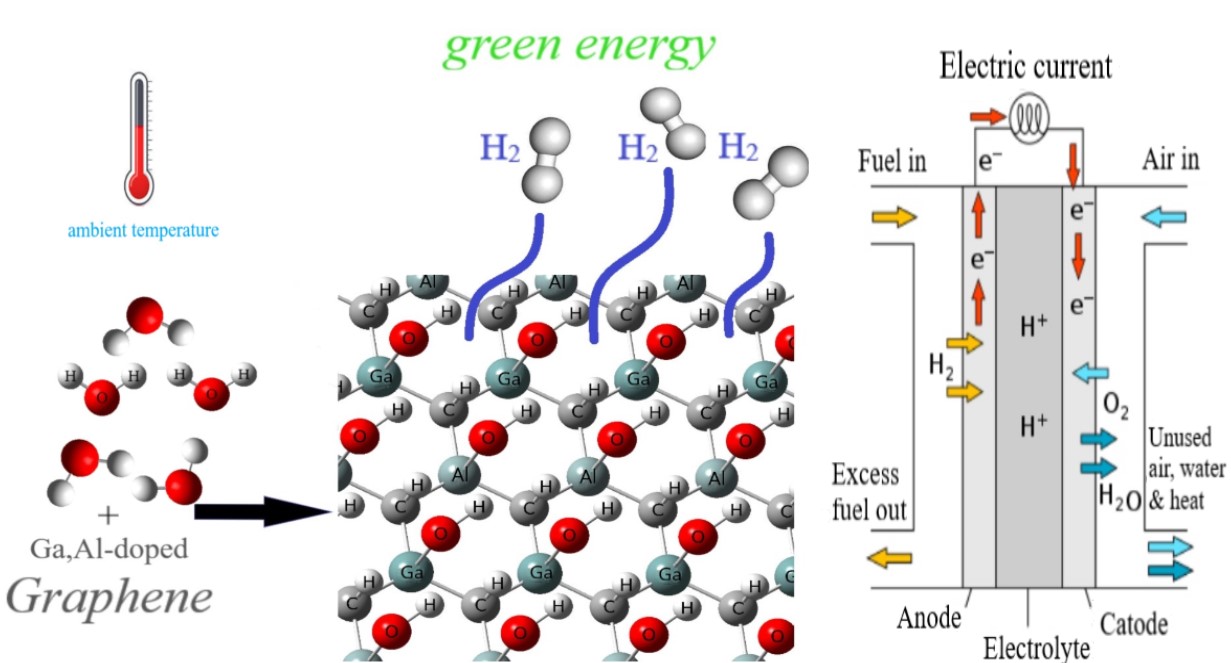
Visual Abstract
Abstract
To use H2 gas as a common fuel it needs to be in high pressures or cryogenic temperatures to have reasonable density. But, if we have adsorbent materials with high volumetric capacities to store hydrogen at ambient temperature and low pressure without any compressing it is worthwhile to use hydrogen as clean and reversible fuel. Here, we want to report the adsorption and decomposition properties of aluminum and gallium-doped graphene at ambient temperature. We studied the adsorption of H2O molecule on pure and doped graphene via density functional theory. So, possible interactions between the H2O molecule from three sides and pure and aluminum and gallium-doped were examined. After adsorption, decomposition of the H2O molecule has been studied and so on, for receive a reaction pathway, possible intermediates and transition states has been studied. To continue the density of states, interaction energies and thermodynamic parameters have been calculated. The results showed that the adsorbed water on aluminum and/or gallium-doped graphene decompose to OH and H and then adsorb on the surface again at ambient temperature and this process was thermodynamically favorable.
Introduction
One of the useful ways for energy storage is the chemical bonds. The advantage of this way was known for decades as the combustion of fossil fuels and breaking C-H bonds. However, COx, NOx, and SOx emissions from fossil fuels cause to necessitate a transition to non-carbon energy fuels [1]. Hydrogen with an energy density about three times more than gasoline and water as it’s the only waste product would help us in the transition to a non-emission energy system [2]. Indeed, it could encourage the application of renewable energy and help transform to use of non-carbon fuels. Today hydrogen for transportation as hydrogen fuel-cells are operating on the road and it is already realized with over 120 hydrogen stations in California and Germany [3]. So, this is encouraging to use hydrogen as a transportation fuel, but this replacement is limited by the problems of hydrogen storage. The finite space of the vehicle and especially the requirement for systems that enhance driving ranges need high density and volume of energy, respectively. On the other hand, storing the hydrogen as a liquid needs a very low temperature with a density of 70 g/L, and as a compressed gas needs a very high pressure (more than 700 bar) with a density of 39 g/L [4]. Refueling both ways is expensive and also developing storage systems for operating under these excessive conditions is difficult. Furthermore, the storage of hydrogen at that pressure needs significant energy for compression. Also, storing at very low temperatures increases storage capacities but seriously reduces the system's volumetric density and causes costs for operating the thermal management. So, we need high-density hydrogen storage with moderate conditions and no cryogenic or highly compressed hydrogen storage [5, 6]. Adsorbent-based systems could be a suitable alternative for this aim. Hence, we can use materials capability for storing at ambient temperature. In the employing tanks for hydrogen gas storage operating at low pressures, being light, less expensive, and more conformable parameters are serious. So, by these or similar capabilities, the fuel cell used in transportation will be provided as well as other uses [7].
In recent years, many scientists interested in the design and synthesis of new materials with mentioned capabilities for hydrogen storage [8–12]. Nanomaterials have been investigated as promising adsorbents for this. In particular, the high surface-to-volume ratio and chemical versatility of these materials cause to increase in hydrogen uptake. It is important to extend active, stable non-toxic, and inexpensive surfaces, too. While using of the transition metal-based adsorbent is limited due to cost and toxicity, many studies report, graphene displays an acceptable surface activity [13–15] and displays a good performance as a catalyst for dehydrogenation reaction [16–18]. Water adsorption on nanostructures like graphene is interesting for many researchers. Amanda J. Carr, et al., studied the adsorption of the water on graphene and graphene oxide experimentally [19]. Ikutaro Hamada studied the adsorption of water on graphene by the van der Waals density functional study and compared the results with the quantum Monte Carlo approaches [20]. In addition, many studies have approved the modification of the physical and chemical properties of graphene by substituting the carbon with the heteroatom. It is because of the changes in electronic structure [21–23]. For example, the surface reactivity of graphene and other nanostructures could be improved by aluminum and gallium doping [24–26]. Also, Yong-an Lv, et al. showed that the aluminum or gallium doping enhanced the graphene activities for adsorption and dissociation of N2O [27]. Qilin Yi, et al. showed that aluminum or gallium doping improved the graphene surface adsorption properties for NF3 and N2O molecules [28]. In addition to the storing problem, we need to have an iminium source of hydrogen to produce and then store. Hydrogen molecules can be produced in different ways. The decomposition of hydrogen-rich material is one of the most attractive ways for hydrogen production. One of the important hydrogen sources for this way is hydrocarbons. Water is the other hydrogen-rich. Water is a safe material that respects the hydrocarbon and is the most material on the earth. For this, water decomposition was interesting for many scientists [29, 30]. So, in this way, hydrogen atoms could be produced from the water, adsorbed and stored on the surface, and then desorbed to produce the hydrogen gasses for use.
In the present work, the adsorption and decomposition of the H2O molecules on the Al and/or Ga-doped graphene sheet have been studied at room temperature and using density functional theory (DFT) calculation. The main aim of this study was the investigation of the H2O molecule’s decomposition mechanism on the graphene surface. Also, the possible reaction pathways and intermediates have been studied for this process. The performance of heteroatom doping on the potentials of graphene for this process and its use as hydrogen storage has been studied, too.
Computational Method
In this work, the investigation of the H2O molecules to adsorption and subsequently dehydrogenation on the graphene sheet was performed by using density functional theory (DFT) and time-depending density functional theory (TD-DFT) and M062X/6–31g(d) method/basis sets. For this study, we have considered the armchair graphene sheet consisting of 25 carbon honeycomb that the end carbon atoms were bonded and saturated by hydrogen atoms. We have studied non-pure graphene, too. So, we have considered the Al-doped graphene as configuration "A”, Ga-doped graphene as configuration "B”, 2Al-doped graphene as configuration "C”, 2Ga-doped graphene as configuration "D” and, Ga, Al-doped graphene as configuration "E”. We have used the QST3 method to calculate the transition state (TS). To confirm the stationary structure with one imaginary frequency, we have done the frequency calculations. All the calculations have been done using the GAMESS program suite [31]. To illustrate the configurations, we used GaussView 5.0.
We have used the following equation to calculate the adsorption energy (Ead) of adsorbed H2O molecule(s) on Ga and/or Al-doped graphene sheet,
\(E_{ad}=E_{(surface+water)}-(E_{surface}+E_{water})\)
where \(E_{surface}\) is the calculated energy of the Ga and/or Al-doped graphene sheet, \(E_{water}\) is the calculated energy of one H2O molecule, and \(E_{(surface+water)}\) is the calculated energy of one H2O molecule adsorbed on Ga and/or Al-doped graphene sheet.
Also, we have studied the density of states, HOMO, and LUMO energy levels for the configurations before and after possible interactions. For this, we used the GaussSum program [32].
Results and Discussion
In this work, we have studied the adsorption and decomposition of the H2O molecules on Ga and/or Al-doped graphene sheets. All structures of the configurations were optimized, energetically at ambient temperature. Also, the surface activity was studied for the doped graphene for H2O molecule adsorption and then the decomposition of two H2O molecules. The size of the considered configurations [33] and the level of theory [34] employed for this study were validated by previous works. To continue we will discuss the process of adsorption and dehydrogenation of H2O molecules on the mentioned surfaces.
Adsorption
Figure 1 illustrates the structure from the top and side view for Al-doped graphene (configuration "A”)) when M = Al or Ga-doped graphene (configuration "B”)) when M = Ga before and after the adsorption of one H2O molecule. Also, the optimized structure of 2Al-doped graphene (configuration "C”)) when M1, M2 = Al, 2Ga-doped graphene (configuration "D”)) when M1, M2 = Ga or Ga, Al-doped (configuration "E”)) when M1 = Ga and M2 = Al, before and after adsorption of two water molecules from top and side view have been shown in this figure.
As is clear in Figure 1, the optimized structures of the mentioned configurations after adsorption of the water molecules changed and were out of the plane, while, they were two dimensions sheet-like graphene before interaction. For a study of the adsorption of H2O molecules on graphene, the H2O molecule is set upright on graphene from the H atom, from the O atom, and one side of the H2O molecule. Adsorption has been studied on the carbon atom and one of the honeycombs. To prevent the edge effects, the center of the studied graphene was selected. There was no any interaction between the H2O molecule and the mentioned studied sites of graphene. In other words, in this work, pure graphene has not adsorbed any water molecule. Then, one of the carbon atoms of the graphene was substituted by one Al atom (configuration A). For this configuration, the adsorption process has been studied on the doped atom site and the H2O molecule from the three mentioned sides. It was seen the only adsorption from the O atom of the H2O molecule, and there was no adsorption from two other sides on the Al atom for configuration A. In continuing configuration B, one carbon atom of graphene has been substituted by Ga and was designed. For this configuration, the adsorption process has been done the same as configuration A, and the H2O molecule only was adsorbed from the O atom on the Ga atom, too. As can be seen from Table 1, the scale of adsorption energy for the studied molecules is in the chemical adsorption range.
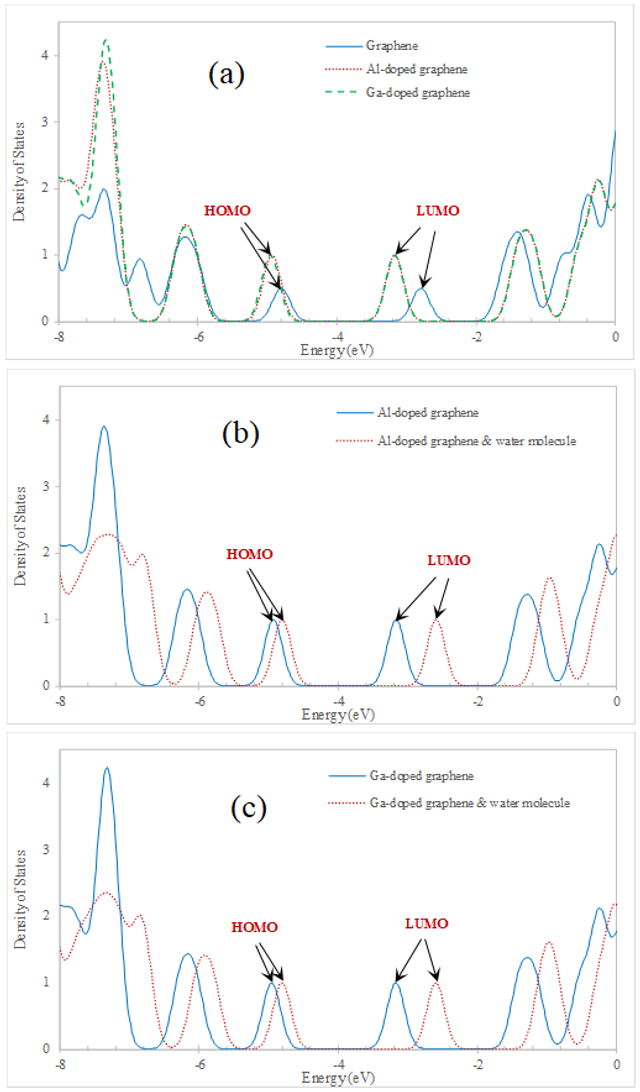
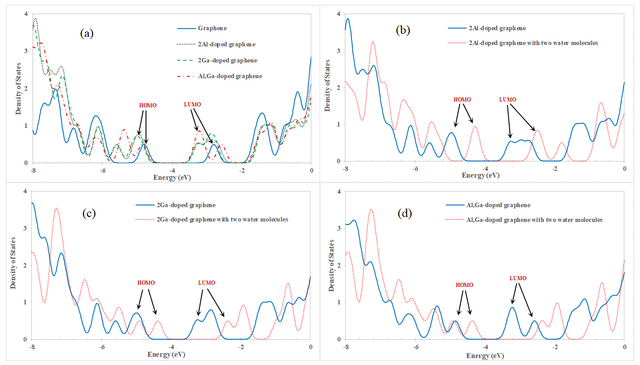
The density of states (DOS) was calculated for graphene and configurations A and B before and after one H2O molecule adsorption. The DOS diagrams for the graphene and mentioned configurations before and after adsorption have been shown in Figure 2. The energies of the HOMO, LUMO levels, and the difference between them (Eg) for these configurations have been shown in Table 1. As is clear from Table 1 and Figure 2, by the adsorption, the HOMO and LUMO energy levels were shifted and also the Eg increased. The Eg for our studied graphene was 2.00 eV, which is in good agreement with other previous studies [35–38]. By the substitution of one C atom by Al or Ga atom the Eg decreases to 1.77 and 1.78 eV, respectively. It means that by doping the conductivity of graphene increases. After the adsorption of one H2O molecule on both configurations A and B, the Eg was changed to 2.21 eV. That change was about 0.43 and 0.42 eV for configurations A and B, respectively. It shows that both the Al-doped and Ga-doped graphene are sensitive to water adsorption.
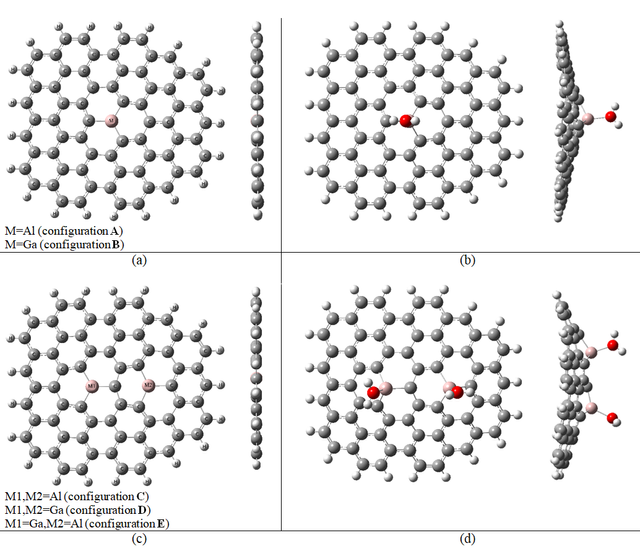
To continue, in the graphene sheet, two carbon atoms were substituted by two Al atoms (configuration C). For this configuration, the adsorption process was studied for the mentioned doped sites and it was seen as the only adsorption from the O atom of the water molecule. Then configuration D is designed in which two previous carbon atoms were substituted by two Ga atoms. For this configuration, the adsorption process has been done the same as configuration C. The last configuration was E that two carbon atoms were substituted by one Ga atom and one Al atom. Also, for this configuration, the H2O molecules only were adsorbed from the O atom on Ga and Al atoms.
The DOS was calculated for configurations C, D, and E before and after the adsorption of two H2O molecules, too. The DOS diagram for the graphene and the three mentioned configurations before and after the adsorption of two H2O molecules have been shown in Figure 3. The energies of the HOMO, LUMO levels, and Eg have been shown in Table 1, too. As the Table 1 and Figure 3, the HOMO and LUMO energy levels were shifted and also the Eg increased for configurations C, D, and E after the adsorption. In Figure 3 (a), the DOS of graphene is plotted beside the DOS of configurations C, D, and E for comparison. By the substitution of two C atoms by Ga and/or Al atoms to design the configurations C, D, and E the Eg decreases to 1.89, 1.95, and 1.70 eV, respectively. So, for these configurations, the conductivity is more than graphene, too. The Eg for the configurations C, D, and E was changed to 1.82, 2.02, and 2.01 eV, respectively by the adsorption of two water molecules. These changes were decreasing for configuration C by about 0.07 eV and increased by about 0.07 and 0.31 eV for configurations D and E, respectively. It shows that configuration E is more sensitive than configurations C and D to water adsorption. Also, the amount of charge transferring (qCT) from the water molecule to the Al and/or Ga-doped graphene after the adsorption process is listed in Table 1. As can be seen from Table 1, the amounts of qCT for all interactions between water and Al and/or Ga-doped graphene are positive.
Configuration | Eads (kcal/mol) | HOMO (eV) | LUMO (eV) | Eg (eV) | qCT (e) |
Graphene | - | -4.79 | -2.79 | 2.00 | - |
A | - | ‑4.93 | -3.16 | 1.77 | - |
A +H2O | -71.41 | -4.80 | -2.59 | 2.21 | 0.16 |
B | - | -4.95 | -3.17 | 1.78 | - |
B+H2O | -77.35 | -4.80 | -2.59 | 2.21 | 0.15 |
C | - | ‑4.86 | -2.97 | 1.89 | - |
C+2H2O | -129.01 | -4.23 | -2.41 | 1.82 | 0.16 |
D | - | -4.89 | -2.94 | 1.95 | - |
D+2H2O | -141.52 | -4.38 | -2.36 | 2.02 | 0.31 |
E | - | -4.84 | -3.14 | 1.70 | - |
E+2H2O | -137.53 | -4.36 | -2.35 | 2.01 | 0.32 |
Decomposition
Decomposition of one H2O molecule
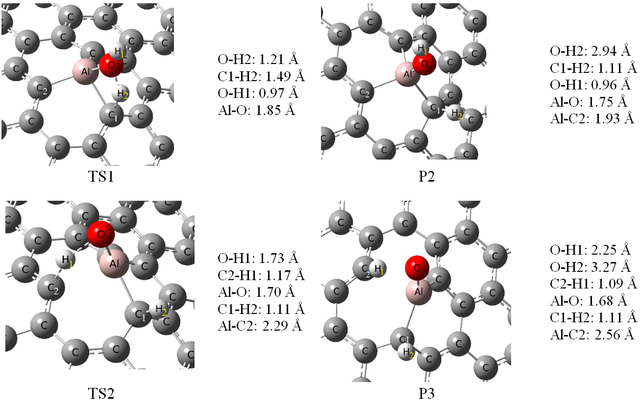
After the adsorption of the H2O molecule on configuration A (or B), the decomposition process starts. For the decomposition of the H2O molecule, it planned to be decomposed two O–H bonds. The first step involves the stretching and then breaking of the two O–H bonds. As configurations A and B are the same for the decomposition steps, we only showed the decomposition process of one H2O molecule on configuration A in Figure 4, for briefness. But, for both configurations, the thermodynamic parameters (reaction energy (ΔE), change of Gibbs free energy (ΔG298), and change of enthalpy (ΔH298)), imaginary frequencies (ν), and corresponding activation energies (Eact) have been summarized in Table 2.
Reaction | Eact (kcal/mol) | ν (cm-1) | ΔE (kcal/mol) | ΔG298 (kcal/mol) | ΔH298 (kcal/mol) |
Configuration A |
|
|
|
|
|
P1→P2 | 14.5 | 1350i | -12.8 | -12.9 | -13.4 |
P2→P4 | 82.4 | 295i | 80.9 | 81.7 | 81.8 |
Configuration B |
|
|
|
|
|
P1→P2 | 19.7 | 1376i | -4.1 | -4.1 | -4.5 |
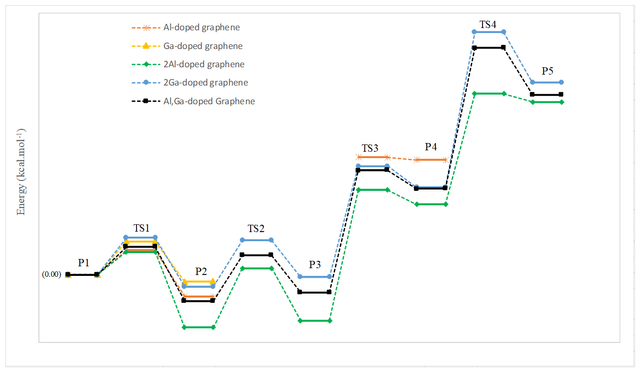
Also, Figure 5 shows the decomposition reaction pathways for an H2O molecule on both configurations A and B. In these ways, the first intermediate (P1) was taken as one adsorbed H2O molecule on configuration A and configuration B (see Figure 5). Breaking of the O–H bond in the first step of the reaction pathway starts with the elongation of it in the adsorbed H2O molecule. In the first step, for the mentioned configurations, the energy barrier was 14.5 and 19.7 kcal/mol, respectively. For configuration A this is smaller than the corresponding activation energy over Co (110) surface (ca. 19.14 kcal/mol) [39]. It shows that these reactions are thermodynamically favored and so takes place at ambient temperature. As can be seen from Figure 4, at the TS1 (first transition state) the O–H2 bond elongated from 0.97 to 1.21 Å (configuration A), and 1.25 Å (configuration B). Also, the O—-Al and O—-Ga distances were shortened from 1.94 to 1.85 and from 2.00 to 1.92 Å, respectively. By elongation, the O–H2 bond the second intermediate (P2) has been created. The lengths of newly formed C1–H2 bond in the second intermediate are 1.11 Å, for both of the mentioned configurations. The energy of the P2 for the configurations A (−12.8 kcal/mol) and B (−4.1 kcal/mol) is lower than the P1.
Initial adsorption energy is −71.41 (configuration A) and −77.35 kcal/mol (configuration B) and the dehydrogenation barrier for configurations A and B are 14.5 and 19.7 kcal/mol, respectively. As can be seen, in this way the initial adsorption energy is large enough for the subsequent dehydrogenations.
In the second step, by breaking another hydrogen atom the dehydrogenation has been studied. For the P2, the O–H1 bond could break while a large activation barrier of about 82.4 kcal/mol for configuration A (Figure 5), and for configuration B this step did not occur. On configuration A, the TS1 structure is verified by an imaginary frequency of the O–H2 stretching vibration mode (1350i cm−1). On configuration B, the imaginary frequency for the same stretching vibration mode is 1276i cm−1. Also, for configuration A, the TS3 structure that corresponds to the second H atom on the H2O molecule for dehydrogenation (O–H1) is verified by an imaginary frequency (295i cm−1).
As can be seen from Tables 1 and 2, the first step with ΔH298 = −13.4, ΔG298 = −12.9 kcal/mol, and reaction energy of −71.41 kcal/mol concerning the initial state for configuration A, and with ΔH298 = −4.5, ΔG298 = −4.1 kcal/mol and reaction energy of −77.35 kcal/mol respect to the initial state for configuration B is exothermic and thermodynamically favored. While the second step with ΔH298 = +81.8 and ΔG298 = +81.7 kcal/mol is endothermic and is not thermodynamically favored. It shows that for the adsorbed H2O molecule on both configurations A and B, the second step of dehydrogenation does not occur easily at ambient temperature.
Decomposition of two H2O molecules
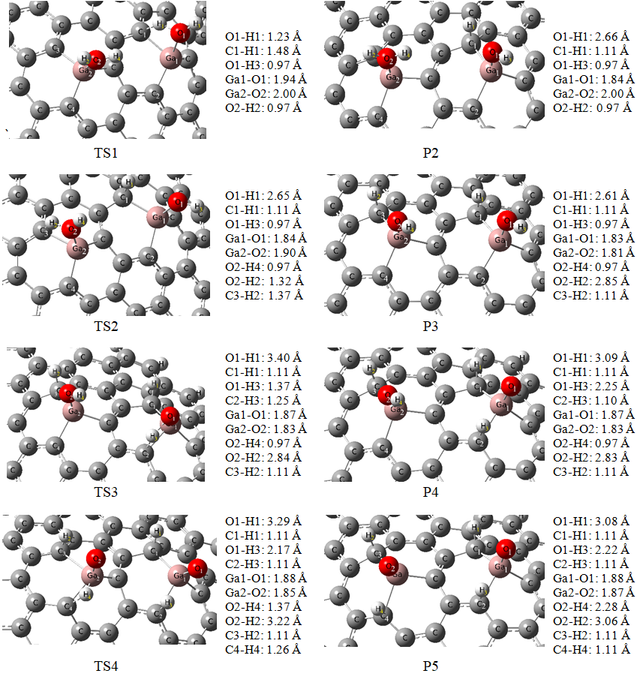
To continue, the decomposition of two adsorbed H2O molecules on the configurations C, D, and E have been studied. The same dehydrogenation steps have been studied for these configurations and so, only the reaction pathway for decomposition of the two adsorbed H2O molecules on configuration D and the optimized structure of stationary points have been shown in Figure 5, for briefness. So, after the adsorption of two H2O molecules, as mentioned, onto the Al atoms (configuration C), Ga atoms (configuration D), or Ga & Al atoms (configuration E), the decomposition would start. The thermodynamic parameters (change of Gibbs free energy (ΔG), reaction energy (ΔE), and change of enthalpy (ΔH)), imaginary frequencies (ν), and corresponding activation energies (Eact) have been summarized in Table 3.
In Figure 5, the first intermediate (P1) has been taken as configuration D with two adsorbed H2O molecules. By studying the first H2O molecule with elongation of the O1–H1 bond, the reaction pathway of dehydrogenation begins. As can be seen in Table 3, the activation energy barrier for this step is 21.8 kcal/mol. This energy barrier is 13.5 kcal/mol for configure C and 16.3 kcal/mol for configuration E. This shows that these reactions would occur rapidly at ambient temperature. The O1–H1 bond elongated from 0.97 to 1.23 Å, and the O—-Ga distance was shortened from 1.99 to 1.94 Å at the first transition state (TS1) on the configuration D (see Figure 6). By elongation, the O1–H1 bond the second intermediate (P2) has been created. The length of the newly formed C1–H1 bond in the P2, is 1.11 Å, and the Ga1—-O1 distance stays at 1.84 Å. The energy of the P2 for configuration D is −7.1 kcal/mol and is lower than the P1 and also, the initial adsorption energy for this configuration is about −141.52 kcal/mol, and dehydrogenation barrier energy is 21.8 kcal/mol. It is clear that, in this way, the initial adsorption energy is large enough for the subsequent dehydrogenations.
In the next step, breaking another hydrogen atom for the dehydrogenation process has been studied. On intermediate P2 configuration, the activation barrier energy for O2–H2 bond splitting was about 27.4 kcal/mol (see Figs. 5 and 6). As the previous step and the first adsorption process are exothermic, this energy barrier could partly offset. On the surface of configuration D the TS1 structure is verified by the imaginary frequency that is related to the stretching vibration mode of the O1–H1 bond and is 1498i cm−1. For the TS2 configuration the bond elongation change for O2–H2 is from 0.97 to 1.32 Å, and the O—-Ga2 was shortened from 2.0 to 1.90 Å. Also, the TS2 structure is verified by the imaginary frequency that is related to the stretching vibration mode of the O2–H2 bond and is 1154i cm−1. In the next step, it needs to study intermediate P3 that is obtained by elongating and breaking the O2–H2 bond. The length of the newly formed C3–H2 bond in the P3 configuration is 1.11 Å, and the distance of Ga2—-O2 is shortened from 2.0 to 1.81 Å.
Reaction | Eact (kcal/mol) | ν (cm-1) | ΔE (kcal/mol) | ΔG298 (kcal/mol) | ΔH298 (kcal/mol) |
Configuration C |
|
|
|
|
|
P1→P2 | 13.5 | 1358i | -31.2 | -28.8 | -32.7 |
P2→P3 | 35.1 | 328i | 4.0 | 2.8 | 5.3 |
P3→P4 | 77.4 | 596i | 68. 8 | 70.0 | 68.3 |
P4→P5 | 65.5 | 376i | 60.7 | 60.2 | 60.5 |
Configuration D |
|
|
|
|
|
P1→P2 | 21.8 | 1498i | -7.1 | -11.1 | -12.2 |
P2→P3 | 27.4 | 1154i | 5.7 | 3.0 | 4.0 |
P3→P4 | 65.6 | 1699i | 53.0 | 58.9 | 57.1 |
P4→P5 | 91.8 | 718i | 62.0 | 57.8 | 57.6 |
Configuration E |
|
|
|
|
|
P1→P2 | 16.3 | 1313i | -15.5 | -14.6 | -15.7 |
P2→P3 | 26.8 | 1163i | 4.9 | 2.8 | 3.4 |
P3→P4 | 72.3 | 1677i | 61.5 | 62.9 | 61.9 |
P4→P5 | 83.4 | 1059i | 55.6 | 58.7 | 57.8 |
By the elongation of the O1–H3 bond, the study of the decomposition reaction pathway of adsorbed water molecules continued. In the TS3 configuration, the O1–H3 bond was elongated to 1.37 Å, and the O1—-Ga1 distance was shortened to 1.87 Å. An imaginary frequency of 1699i cm−1 in the TS3 is related to the mode of the O1–H3 bond. Then, for obtaining the intermediate P4 the O1–H3 bond breaks. The length of the C2–H3 bond in the P4 is about 1.10 Å, and the Ga1—-O1 distance stays at 1.87 Å. The reaction energy of this step is about +53.0 kcal/mol and it needs to pass the activation energy barrier of about 65.6 kcal/mol, relative to P3, with ΔH298 = +57.1 and ΔG298 = +58.9 kcal/mol. So, this reaction would not arise at ambient temperature because this is not thermodynamically favored.
In continuation of the decomposition process, the O2–H4 bond at the TS4 configuration was elongated to 1.37 Å, and the O2—-Ga2 distance was shortened to 1.85 Å and an imaginary frequency of 718i cm−1 in the TS4 is related to O2–H4 bond elongation. By breaking, the O2–H4 bond, intermediate P5 is obtained. The length of the C4–H4 bond in the P5 configuration is 1.11 Å, and the Ga2—-O2 distance stayed at 1.87 Å. The calculated activation energy and reaction energy for this step are 91.8 and +62.0 kcal/mol, respectively. Also, as can be seen from Table 3 ΔH and ΔG for this step are +57.6 and +57.8 kcal/mol, respectively. These results mean that this reaction would not arise at ambient temperature because of the thermodynamic limits. So, for this configuration, the second H atoms of two water molecules (H3 and H4) bonded to O1 and O2 atoms, respectively, instead of bonding to the carbon atoms of the studied surface. This is because of the aromaticity of the sheet. The O atom creates a double bond with the Ga atom of configuration D and it disturbs the aromaticity of the sheet. So, it means that the reaction is not kinetically preferable.
Reaction pathways for the mentioned studied configurations show that the one-step dehydrogenation of the adsorbed H2O molecules could be suitable. The H2O molecules are decomposed to H and OH on the Al-doped, Ga-doped, and Al, Ga-doped graphene. In other words, after the decomposition of the water molecule on the mentioned surfaces, the hydrogen atoms are adsorbed on carbon sites on the graphene sheet and OH remains on the doped atoms in the studied surfaces. The H atoms could decompose and produce the H2 molecules at ambient temperature, while, it not possible for OH to decompose from the doped sites in this situation. It is predictable because the bond energy of Al–O (119.74 kcal/mol) and Ga–O (89.38 kcal/mol) are stronger than the C–H bond (80.78 kcal/mol) [40]. There are almost infinite sites on the studied surfaces to bond with the decomposed H atoms. So, we believe that the Ga and/or Al-doped graphene could be a suitable catalyst for the dehydrogenation of H2O molecules and also convenient storage to store and then produce H2 molecules on a large scale at ambient temperature.
Conclusion
The pursuit of structures capable of adsorbing and storing hydrogen has already focused on storage by binding hydrogen on their infinite atoms at ambient temperature. We have targeted graphene as a nanostructure for its infinite carbon atoms to be adsorbent sites and water molecules as a hydrogen-rich safe material. Pure graphene has not adsorbed any water molecule. So, graphene adsorption has been improved by substituting the percent of carbon atoms with gallium and/or aluminum atoms. Adsorption and then decomposition of water molecules have been done on doped graphene. One of the water’s hydrogen atoms dissociated and adsorbed on the graphene’s carbon atom and the second hydrogen atom preferred to be with the oxygen atom of water bound on the gallium or aluminum atom. This decomposition and hydrogen adsorption process was exothermic and thermodynamically favored. So we have an adsorbent with high volumetric capacities to store hydrogen at ambient temperature and low pressure without any compressing and use energy.
Statements and Declarations
Competing interests
The author declares no competing interests.
Ethics approval
Not applicable.
Data availability
All data generated or analyzed during this study are included in this published article.
Funding
No funding was received to support this work.
Acknowledgment
This work has been supported by Damghan University.
Author Information
Sadegh Afshari—School of Chemistry, Damghan University, Damghan, Iran;